Esta obra está bajo una Licencia Creative Commons Atribución-NoComercial-CompartirIgual 4.0 Internacional
Quinto Sol, vol. 30, n.º 2, mayo-agosto 2026,
ISSN 1851-2879, pp. 1-33
http://dx.doi.org/10.19137/qs.v30i2.9730
Esta obra está bajo una Licencia Creative Commons Atribución-NoComercial-CompartirIgual 4.0 Internacional
Dossier
Re-Visualizing History: Towards a New View of the Spanish Invasion of the Andes (1530s)
Revisualizando la historia: hacia una nueva mirada de la invasión española de los Andes (1530s)
Reavaliando a história: rumo a uma nova perspectiva sobre a invasão espanhola nos Andes (década de 1530)
Jeremy Mikecz
Dartmouth College
Estados Unidos
Correo electrónico: Jeremy.M.Mikecz@dartmouth.edu
ORCID: http://orcid.org/0009-0002-2874-9956
Abstract
In this article, I will discuss how to answer the following questions: How can we visualize patterns embedded in historical texts? How can we map texts and observe narratives? And why do so? To this end, I incorporate digital maps, qualitative visualization, and a careful reading of historical texts. Qualitative, humanistic, and narrative visualizations can complement ethnohistorical efforts to recover knowledge of the Indigenous past during the colonial period. In particular, I will describe the methods I have adapted from various disciplines—including experimental and narrative cartography, literary geography, and data science—to reimagine the Spanish invasion of the Inca Empire (1530s). These procedures allow us to make visible the silences in the texts and reveal what colonial authors concealed. For example, they highlight the importance of Andean allies and diplomacy for the conquest of Peru, as well as how they wrote narratives of domination from centers of colonial power surrounded by a vast Andean territory beyond their control. Likewise, the routes and journeys of armies, embassies, messengers (chaskis), and native spies can be viewed and mapped. Recognizing these activities places Andean peoples at the center of narratives frequently dominated by the Spanish and a few indigenous elites.
Keywords
Colonial History; maps; visualizations; cartography
Resumen
En este artículo discutiré de qué modo se pueden responder estas preguntas: ¿cómo visualizar patrones incrustados en textos históricos?, ¿cómo mapear textos y observar narrativas? y ¿por qué hacerlo? Para ello, incorporé mapas digitales, visualización cualitativa y una lectura atenta de los textos históricos. Las visualizaciones cualitativas, humanistas y narrativas pueden complementar esfuerzos etnohistóricos para recuperar el conocimiento del pasado indígena en la época colonial. En particular, describiré los métodos que he adaptado de varias disciplinas —incluida la cartografía experimental y narrativa, la geografía literaria y la ciencia de datos— para re-imaginar la invasión española al imperio de los incas (década de 1530). Estos procedimientos permiten visibilizar los silencios de los textos y demostrar lo que escondían los autores coloniales. Por ejemplo, la importancia de los aliados andinos y la diplomacia para la conquista del Perú, también cómo escribieron narraciones de dominación desde centros de poder colonial rodeados de un vasto territorio andino fuera de su control. Asimismo, se pueden ver y mapear los itinerarios y viajes de los ejércitos, de las embajadas, los mensajeros o chaskis, y los espías nativos. El reconocimiento de esas actividades pone en el centro a los andinos en relatos dominados frecuentemente por los españoles y unas pocas élites indígenas.
Palabras clave
historia colonial; mapas; visualizaciones; cartografía
Resumo
Neste artigo, discutirei como responder a estas perguntas: como visualizar padrões embutidos em textos históricos?, como mapear textos e observar narrativas? e por que fazer isso? Para tal, incorporei mapas digitais, visualização qualitativa e uma leitura atenta dos textos históricos. As visualizações qualitativas, humanísticas e narrativas podem complementar esforços etnohistóricos para recuperar o conhecimento do passado indígena na época colonial. Em particular, descreverei os métodos que adaptei de várias disciplinas —incluindo cartografia experimental e narrativa, geografia literária e ciência de dados— para reimaginar a invasão espanhola ao império inca (década de 1530). Esses procedimentos permitem revelar os silêncios dos textos e demonstrar o que os autores coloniais ocultavam. Por exemplo, a importância dos aliados andinos e da diplomacia para a conquista do Peru, bem como a forma como escreveram narrativas de dominação a partir de centros de poder colonial cercados por um vasto território andino fora de seu controle. Da mesma forma, é possível visualizar e mapear os itinerários e as viagens dos exércitos, das embaixadas, dos mensageiros ou chaskis e dos espiões nativos. O reconhecimento dessas atividades coloca os andinos no centro de relatos frequentemente dominados pelos espanhóis e por algumas poucas elites indígenas.
Palavras-chave
história colonial; mapas; visualizações; cartografia
Recepción del original: 1 de septiembre de 2024.
Aceptado para publicar: 31 de marzo de 2025.
Re-Visualizing History: Towards a New View of the Spanish Invasion of the Andes (1530s)
1. Introduction
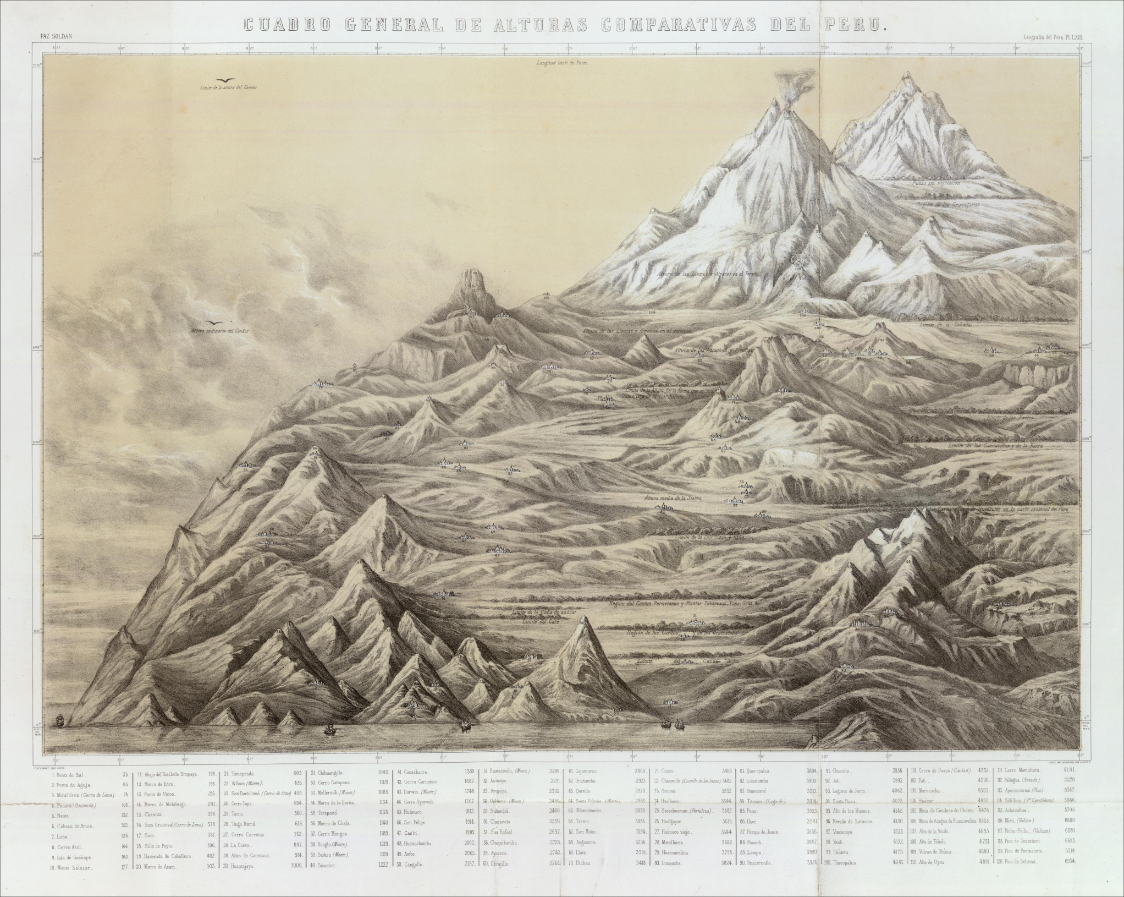
Image 1. Mariano Felipe Paz Soldán (1865). Cuadro general de alturas comparativas del Perú (General Chart/Picture of Comparative Altitudes of Peru)
Source: David Rumsey Map Collection, David Rumsey Map Center, Stanford Libraries. https://www.davidrumsey.com/maps2722.html. Image in public domain.
Appearing near the end of the first published atlas of Peru is a remarkable, two-page lithographic profile of the mountains and towns of Peru (Image 1). It is so large (52 cm high x 65 cm wide foldout page), it must be folded to fit within an atlas that itself measures 54 cm high x 43 cm wide. On first glance, it would be easy to describe this image, found near the end of Mariano Felipe Paz Soldán’s 1865 Atlas geográfico del Perú, as a map, elevation profile, or an artistic rendering of landscape.[1] However, a closer look indicates an image that defies easy characterization.
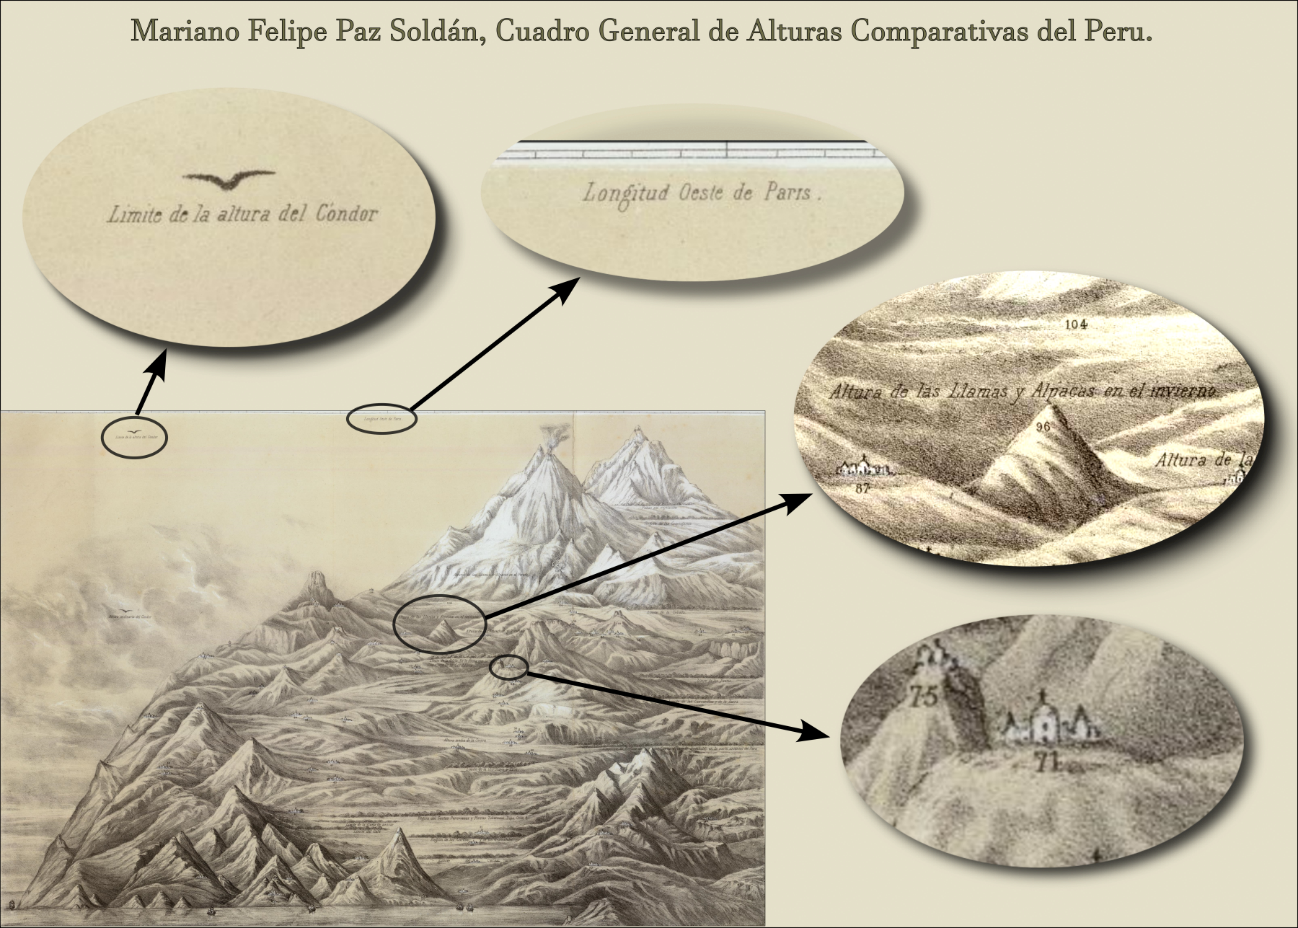
Image 2. An annotated version of Paz Soldán’s “Cuadro general” with inset circles and labels showing, in clockwise order: the upper limit of the condor’s flight, longitude measured from Paris, the elevation of llamas and alpacas in the winter, and the elevation of Cusco (labeled #71).
Source: Adapted by author from Image 1.
Starting from the top, two labels reveal its origins (see the zoomed-in insets added to Image 2). First, Paz Soldán labels the longitude of each location, but in reference to the Paris meridian, an implicit reference to the fact the Atlas was printed in Paris. The Prime Meridian through Greenwich, England, would not be internationally adopted until two decades later and would be resisted by the Francophone world for decades after that.[2] Second, above the clouds one can see a silhouette of a condor in flight, highlighting that this Atlas maps the majestic Andes. Although printed in France, the nascent government of Peru funded Paz Soldán’s work.
As your gaze scrolls down into mountain landscapes, numbered labels appear denoting Peruvian cities and towns (such as Cusco, #71) as well as mountain peaks, mines, lakes, plains, and other geographic features. A chart at the bottom of the foldout (shown in Image 1) identifies the names and elevations (in meters above sea level) of these numbered locations. Other labels on the image are written out in full. These mark the approximate elevation zones of animal herds (i.e. llamas/alpacas), crops (from the frost-resistant barley near the top to cacao near the bottom), and wild plants and animals.
Paz Soldán created this mountain profile in the midst of a golden age of visualization that spanned the second half of the nineteenth century. Today, we would consider Paz Soldán’s drawing to be a data visualization, a term now closely associated with data science and computationally-drawn plots, charts, and maps. These data visualizations most commonly display quantitative information through a standard set of plot types (bar, line, and scatter plots, for example) often intended to quickly yield easy conclusions.[3] However, some data scientists, journalists, storytellers, and digital humanists have embraced the use of visualization to reveal complex patterns buried deeply in heterogenous data and to tell stories from qualitative data. This article encourages digital humanists to seek inspiration not just in the computational renderings of data scientists but also in the often elegant, beautiful, sophisticated, and enlightening graphics of the pre-digital age of infographics (roughly 17th – 20th centuries). Pre-digital visualizers created graphics that entertain as well as enlighten; provoke exploration as well as propose conclusions; and convey qualitative as well as quantitative information. Besides Paz Soldán’s mountain profile, this article will explore several other innovative graphics including a subversive 1675 road atlas, a groundbreaking 1869 infographic, nineteenth century silhouettes, and some modern visualizations created with computers. I will then share how these graphics and maps have inspired my own efforts to recover and re-visualize alternative visions and stories of the 1530s Spanish invasion of the Inka Empire.
Geographers and cartographers would probably identify Paz Soldán’s graphic as a geovisualization. Geovisualizations render geospatial data in ways that go beyond traditional two-dimensional maps, including interactive online maps, elevation profiles, and three-dimensional terrain models. The science and art of these modern geovisualizations, however, owes much to a series of pre-digital technological revolutions that culminated with the visualization golden age. The maps and geovisualizations of Paz Soldán’s 1865 atlas, for example, draw on thousands of years of innovations in cartography, the early modern development of more advanced navigational and measurement tools, and the publication revolution of the nineteenth century, which included the development of lithographic presses (like the one used to print this image).[4] Adopted widely in the first few decades of the nineteenth century, lithographic printing allowed the rapid printing of artistic, high-resolution images for the first time and inaugurated a “media explosion” (Mainardi, 2017).
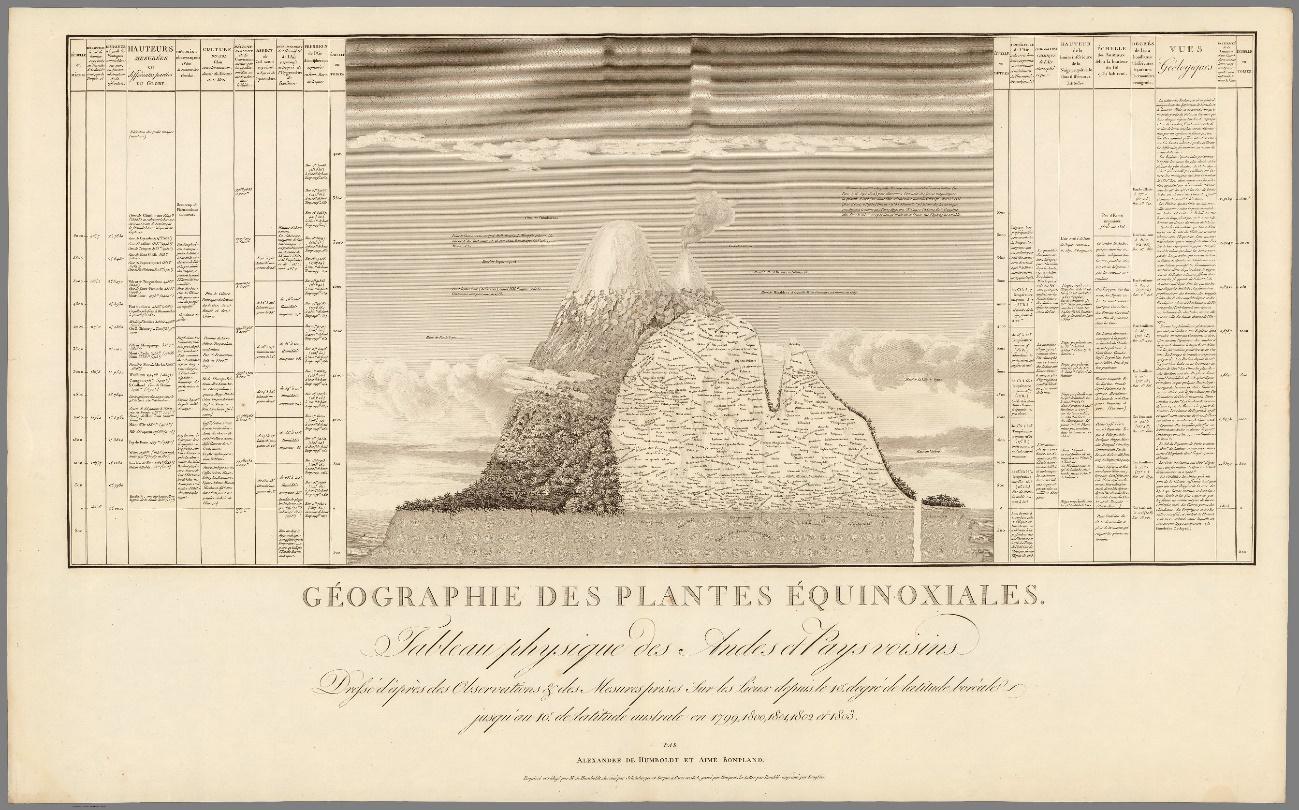
The nineteenth-century revolution in printing technology provided the medium for the creation of new, innovative graphics. Cartographers and geographers, for example, began to move beyond the focus on navigation, exploration, and imperial conquest found in early modern Western cartography to create various thematic and data maps intended to compare and analyze geographic information from disparate places. Instead of just claiming territory and mapping routes, these new maps illustrated natural (climate, ecology, topography, etc.) and social patterns (demography, economy, etc.). Paz Soldán also built on a new genre of geographic atlases, that itself had deep roots in the Americas. Alexander von Humboldt famously traveled throughout the Americas between 1799 and 1804; from which he crafted a lifetime of groundbreaking and richly visualized publications. Among these was his 1805 cross-section profile of the Andean volcanos Chimborazo and Cotopaxi (co-authored with Aime Bonpland, Image 3)[5] and his atlas of New Spain (Mexico), completed in 1811 (Humboldt, 1811). In the latter, Humboldt devised or built on new ways for visually comparing natural resources, populations, and territories. In the former, he sketches the elevations of Andean plants on the image itself, while charting —on either side— the mountains, crops, animals, air pressure, temperature, and humidity found at each elevation in the Andes and elsewhere in the world. Humboldt’s contributions have their flaws. He barely acknowledged the South American scientists, geographers, and artists who influenced his work (Zimmerer, 2011, p. 129; Capello, 2020, p. 57).[6] Furthermore, in his images, Latin American people often only appear dwarfed by grandiose landscapes, when they appear at all, conveying the idea that the region’s inhabitants were shaped by nature rather than shaping it. Nonetheless, Humboldt’s atlases had a far-reaching impact. Paz Soldán’s sketch of Andean mountains draws on the graphic innovations of Humboldt and his lesser-known peers.
Image 3. Alexander von Humboldt’s “Geography of Equatorial Plants: Physical chart of the Andes and Neighboring Countries” (1805).
Source: David Rumsey Map Collection. Image in public domain.
A similar revolution in visualization methods is just beginning. Today’s data visualizers are adapting and developing new computational methods to visualize, analyze, and present information. Data scientists and journalists have been at the forefront of this revolution. For humanities and historical scholarship, visualization remains a largely under-utilized tool.[7] Certainly, many scholars employ innovative methods to reconstruct the history of Indigenous, enslaved, and other marginalized people and to interrogate historical silences (one classic and two oft-cited recent examples include: Trouillot, 1995; Fuentes, 2018; Townsend, 2019). Yet, their analysis and presentation of their results remain largely confined to the written word.[8] Another challenge for historians is how to adapt digital methods to create a third way between the macroanalysis of quantitative history and the close reading of narrative history (for one example, see: Franzosi, 2017).
Moreover, to effectively employ visualizations in humanities scholarship, we must move beyond the limited graphical approaches employed by the sciences, corporate data analytics, and statistics (Knowles et al., 2014; D’Ignazio & Klein, 2020; Drucker, 2020). Humanistic scholarship requires new methods to handle the imprecise, qualitative, storytelling, experiential, and deeply critical elements of humanities research. It also requires humanists, journalists, and storytellers to expand their readers’ visual and data literacy to include graphics that tell stories, invite interaction, convey uncertainty and imprecision, represent humanity as well as data, and provoke reflection.[9] Fortunately, inspiration for the coming visualization turn in the humanities may be found in diverse places. These range from sixteenth-century Indigenous maps and nineteenth-century atlases and infographics to some innovative twenty-first century digital graphics made by data journalists and digital humanists. Just as Paz Soldán and other nineteenth-century geographers expanded the informative and analytical capacity of the map, data visualization need not be limited to the display of quantitative data designed to be quickly interpreted. Instead, visualizations can also reveal hidden patterns in qualitative data, tell overlooked stories, and be read like a novel.[10] In the pages that follow, we will examine how pre-digital infographics and visualizations inspire a new look at one of history’s most dramatic and misunderstood events: the Spanish invasion (the so-called “Conquest”) of the Inka Empire.
2. Plotting the Traveler’s Experience: Road Maps of Invasions
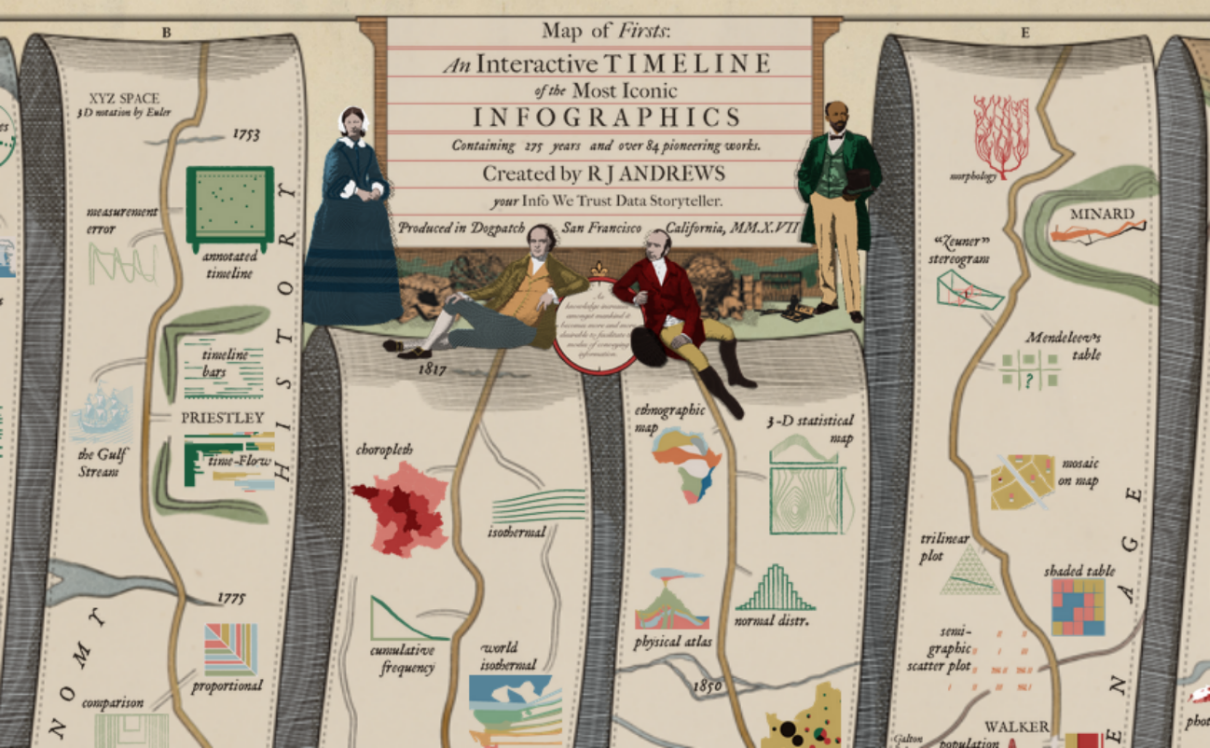
Image 4. A screenshot of R. J. Andrews (2017a)
Source: We are grateful to Andrews for permitting us to reproduce this image (Andrews, 2017a, 2017b).
There may be no better way to summarize the history of infographics than through an infographic. That appears to have been data storyteller R. J. Andrews’ (2017a) thought when he created the “Map of Firsts: An Interactive Timeline of the Most Iconic Infographics”. In this interactive, online graphic (Image 4), Andrews charts the history of pre-digital information graphics and data visualizations, focusing on the period between 1630 and 1904. Most interestingly, to draw this history, Andrews mimics the style of one groundbreaking work of this period: John Ogilby’s Britannia (1675), one of the first known comprehensive road atlases ever published.
John Ogilby was appointed Britain’s royal cosmographer in 1674 and published his Britannia atlas in 1675, just a year before his death. His strip maps are the “ancestors” of twentieth-century route planners and twenty-first century navigation systems (Ereira, 2019). In contrast to the imperial maps his contemporaries were making of distant territories, Ogilby’s maps of the homeland seem innocuous. His quaint scrolls show Britain’s roads connecting major cities to distant hamlets (see one example in Image 5 below). Conquest and war, however, were also on Ogilby’s mind. As Alan Ereira has shown, Ogilby ignored some major British cities (like Liverpool) while mapping in detail impassable or even non-existent roads to rural backwaters. Britannia was also a luxury good beyond the reach of almost any contemporary traveler: it was large, heavy, and expensive. Instead, as Ereira argues, Ogilby’s atlas had a secret purpose and narrow audience in mind. King Charles II was plotting to convert to Catholicism and had recently negotiated a secret treaty with the French, in which they would send 6000 troops to invade England and help Charles secure this transition against domestic opponents. Thus, Charles’ cosmographer, Ogilby, crafted a map to guide a foreign invasion and hid it in plain sight.
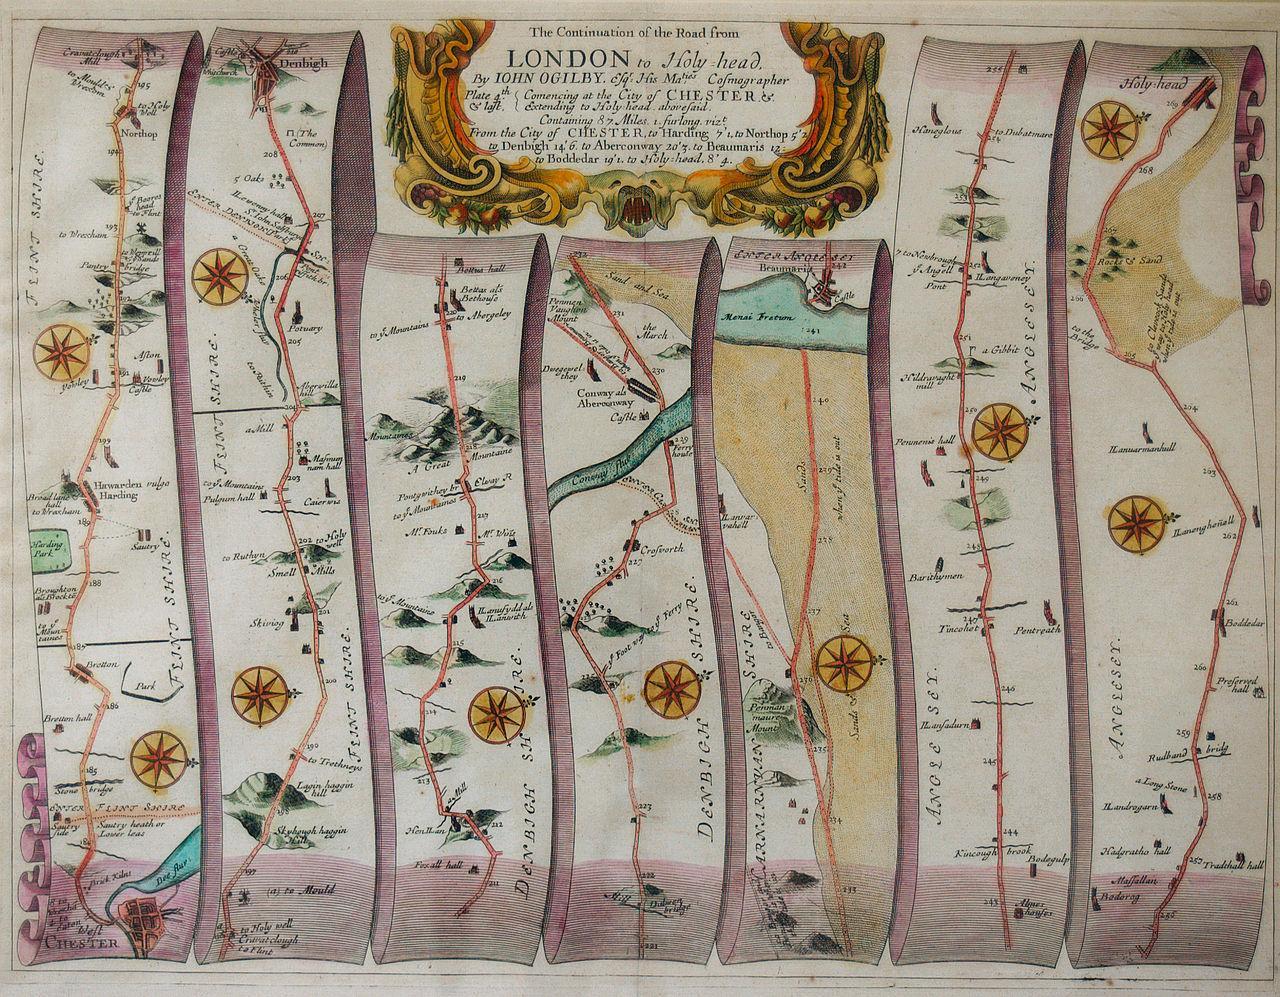
Image 5. The road from London to Holy Head (continued), commencing at Chester in John Ogilby's Britannia
Source: Ogilby,J. (1675). Britannia: Or, An illustration of the kingdom of England and dominion of Wales: By a geographical and historical description of the principal roads thereof. Volume 1, plate 24. Image in public domain.
The Catholic takeover of Britain never happened. Nonetheless, despite Ogilby’s ulterior motives, the stylistic achievements of his road atlas have inspired my efforts to visualize and map events of the sixteenth-century Spanish invasion of the Inka Empire and the Andes. However, where Andrews applies the style and symbolism of Ogilby’s atlas to represent a chronological lineage of ideas (Image 4), I wish to return to Ogilby’s original intent: to map the route of travelers (or, more precisely, to plot the passage of invading armies) through a natural and cultural landscape. I wanted to do so to challenge myths of conquest and domination that have persisted since the 1530s.
One myth, started by Spanish eyewitness authors, was that Inkas and Andeans were slow to adapt adequate military tactics to defend against Europeans’ firearms, steel armor and weapons, and —above all— horses.[11] Historians who have perpetuated this myth have emphasized the ease of the Spanish advance through the Inka Empire in 1532 and 1533.[12] However, a closer look at a series of events that began a few years later challenges this myth of European military dominance and Indigenous tactical failure. Between 1536 and 1537, the Inka ruler Manqo Inka organized a sophisticated campaign of resistance against his former allies, the Spaniards.[13] He first sent several armies to Cusco, where they laid siege to the roughly two hundred Spaniards and their thousands of Native allies occupying the city. He then sent other armies toward Lima with the objective to wipe the Spaniards off the map. On the way, they tracked down and defeated five Spanish campaigns in succession, annihilating the first four and sending the leader of the fifth running back to Lima with “his tail between his legs” (Guillén Guillén, 2005, pp. 138-140). Finally, Manqo Inka’s general Kisu Yupanki laid siege to the Spanish colonial capital of Lima, bringing the entire colonial enterprise in the Andes to the brink of collapse (Mikecz, 2024a).
Many sixteenth-century Spanish authors who narrated these events emphasized their great numerical disadvantage, the divine intervention that saved them from near disaster, and the courage and audacity of their cavalry charges to break their enemy’s ranks and spirits (Nir, 2015). In recent centuries, military historians have pointed to Indigenous failure, highlighting how slow the Inkas were to develop effective anti-cavalry tactics (Prescott, 1847; Guilmartin Jr., 1991; Himmerich & Valencia, 1998.). Since the 1970s, ethnohistorians who have read Indigenous accounts have increasingly refuted these claims. They especially challenge the assertions of a numbers imbalance by showing that the Spanish repeatedly benefited from the assistance of thousands of Andean allies, who saved them at their most vulnerable moments (Espinoza Soriano, 1967, 1972; Guillén Guillén, 1974, 2005; Rostworowski de Diez Canseco, 1981; Vega, 1992; Cahill, 2003). The claim of Spanish technological or tactical superiority, however, has persisted. I wondered: could visualizations confront myths where words failed?
A closer look at Manqo Inka’s War (1536-1537) and its geography suggests new interpretations. In the siege of Cusco, Manqo’s armies successfully neutralized the Spaniards’ one unequivocal military advantage: horses. By barricading, post-holing, and flooding the streets, and destroying bridges, they forced the Spaniards to dismount their horses. By bombarding the city with flaming arrows and slingshots, they forced the foreigners to take cover. However, the Inkas demonstrated their greatest military dominance in routing five consecutive expeditions sent by Pizarro in Lima to rescue his compatriots in Cusco. These victories contrast sharply with the events of 1532 and 1533, when the invaders seized the emperor Atawallpa (Nov. 1532), executed him (July 1533), and then marched through the heart of the empire to Cusco (Aug - Nov. 1533), a journey narrated by eyewitnesses as a relentless forward advance.
How can we explain the vastly different outcomes of the Spanish military campaigns in 1533 and 1536? For some scholars, the answer lies with geography. For John Hemming (1970), who traveled extensively through the Andes in the 1960s, the topography of the central Andes “nullified” the “superiority of Spanish horses and weapons” for the 1536 campaigns. This region, after all, is “one of the most vertical places on earth, an endless succession of crumbling precipices, savage mountain torrents, landslides and giddy descents.” Inka armies found a “really effective natural ally” in this vertical landscape (p. 205).
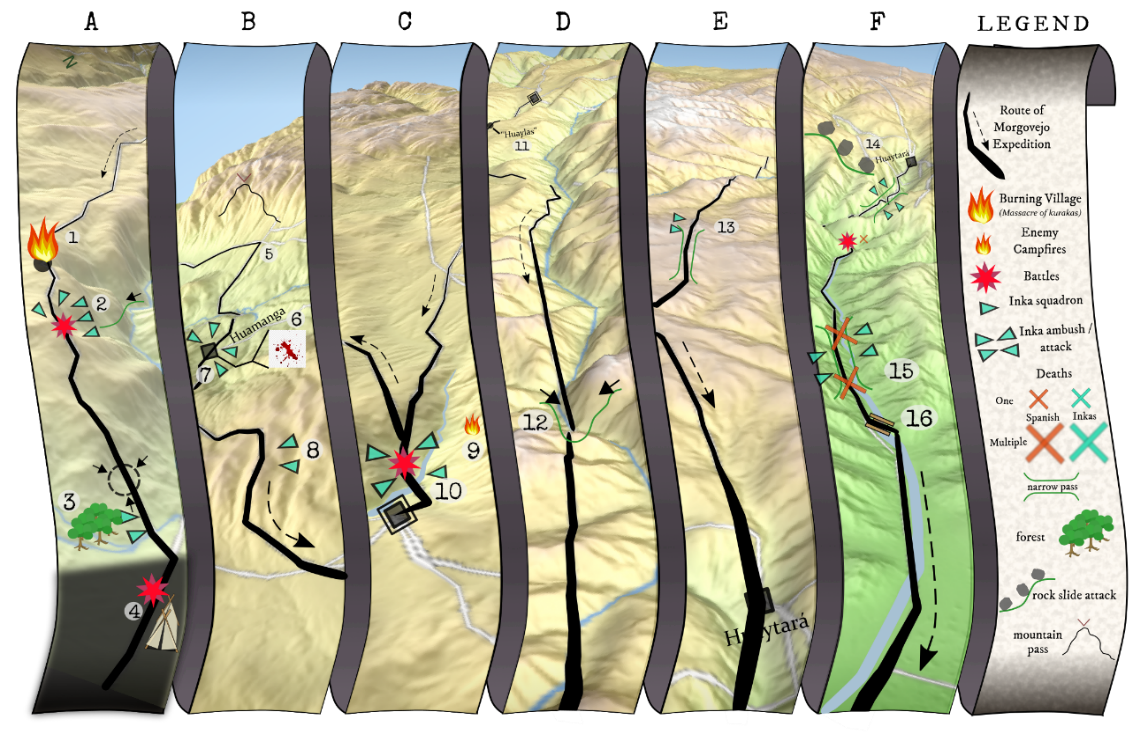
Yet, if we look more closely, the argument for geography as a “natural ally” weakens. In 1536, the Inkas first overtook some of the Spanish reinforcements on the same roads that Pizarro found so accommodating to his advance in 1533. Mapping the Inkas’ pursuit and the Spaniards’ flight in 1536 offers other interpretations. Image 6, for example, integrates Ogilby’s scroll format with a three-dimensional terrain model to map one of these five doomed campaigns: the Inkas’ relentless pursuit and annihilation of Francisco de Morgovejo Quiñones’s expedition. Inserting topographic models into Ogilby’s scroll format allows the mapmaker to overcome two cartographic challenges. First, the exact route of Morgovejo’s ascent into the mountains and his subsequent retreat are unclear (Mikecz, 2024b). Traditional Cartesian two-dimensional maps highlight the location of events and, thus, demand a certain geographic precision. The terrain models of Image 6, as mapped onto these scrolls, however, focus the eye not on location but on topography. Even if the Inkas pursued Morgovejo through a different ravine or across a different mountain pass than those in the figure, the cartographic narration of the event does not change significantly. Second, the events of this pursuit —as recorded by an eyewitness account— are unevenly distributed and difficult to view on a traditional quadrangular map. Episodes of intense action in a deep ravine or at the edge of a precipice are followed by relentless chases lasting days and traversing dozens or hundreds of kilometers of terrain. Nor can a traditional map evoke the fear and terror experienced by the Spaniards during their desperate flight back to the coast.
The linearity of these scrolls re-creates the experience of a traveler or invader traversing unfamiliar landscapes. Only the towns and sights found along the road are visible, while other locations fade away with the nearest horizon. Adding a three-dimensional view of the landscape further highlights the limited visibility and the difficulty of travel along Andean roads.
Image 6. The flight of Francisco de Morgovejo's expedition from the relentless pursuit by Kisu Yupanki's army.
Source: created by author.
Yet, Spanish invaders had marched over these same roads with relative ease just three years earlier. How did hospitable lands transform into hostile landscapes? I argue the answer lies where Inka and Andean agency intersects with Andean geography (Mikecz, 2024a). In 1533, roadside Andean communities provided Francisco Pizarro and his entourage with constant aid and support, while various Inka and Andean allies relayed news and information about the lands and peoples ahead. In contrast, in 1536, many of the Spaniards’ former allies turned against them. Cutting off Morgovejo from the information networks that previously had benefited Pizarro, the Inkas repeatedly ambushed Morgovejo. Morgovejo and his entourage feared what they would find around the nearest bend or over the next hill. They also lacked the magnitude of Indigenous and African aid that assisted their predecessors’ march to Cusco just three years prior.
3. Tracing Humanity: The Invisible Caravan
Effective data visualizations —whether from the pre-digital or digital era— reveal links between disparate types of information and show patterns otherwise hidden from view. A question remains: how can we better employ the basic elements of data graphics —points, lines, and polygons as well as color, hue, shading, and transparency— to represent the lives of human beings? For centuries and even millennia, artists have used visual media to convey human experience and relate human stories. Perhaps the solution for humanistic visualization is to integrate the artist’s imagery and aesthetic touch with the historian’s storytelling, the geographer’s maps, and the data visualizer’s graphic renderings.
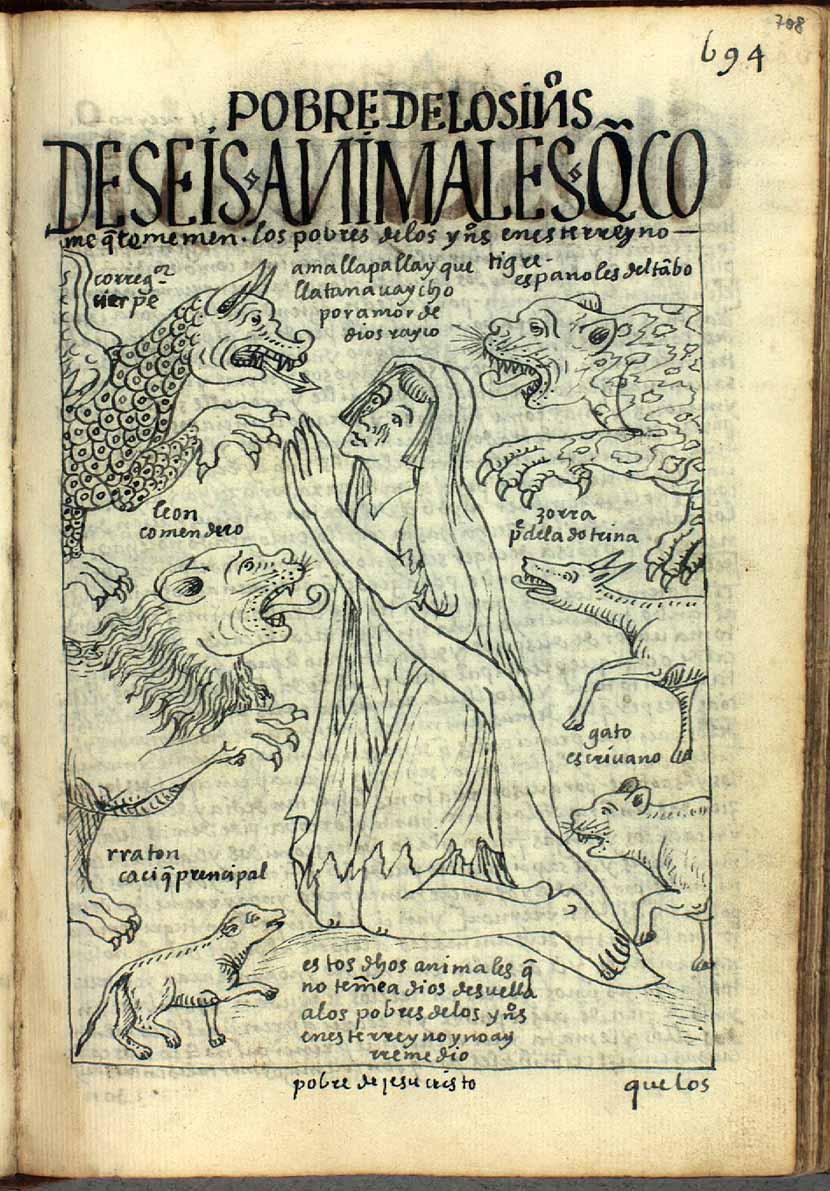
The challenge is to recover the traces of the human stories —and humanity — of Indigenous and other people who endured the ravages of the four horsemen of the early modern apocalypse: war/conquest, disease/famine, colonialism/imperialism, and enslavement/dehumanization. This fact was recognized by the Indigenous Andean author, Guaman Poma, in the late sixteenth and early seventeenth centuries. In his more than 1,000-page tome addressed to the King of Spain, he visually documented the many Andean and non-Andean people harmed by Spanish colonial governance. He also called out some of the worst offenders, as shown in his allegoric sketch of the six “animals” that terrorized Andean people (Image 7).
Image 7. The six “animals” that terrorized Andeans in the colonial period, according to Guaman Poma
Source: Guaman Poma de Ayala, F. (1615). El primer nueva corónica i buen gobierno [Manuscript (GKS 2232 4o [(quarto)]), fol. 706v. 1. Det Kongelige Bibliotek (The Royal Danish Library), Copenhagen. http://www.kb.dk/permalink/2006/poma/info/en/project/project.htm.
Note: These animals symbolized local Spanish lords (known as encomenderos, represented by the lions) —and, in clockwise order from there— provincial administrators (corregidores, represented by the serpents), Spanish travelers (tigers), priests (foxes), notaries (cats), and, finally, Indigenous leaders who collaborated with the colonial regime (rats).
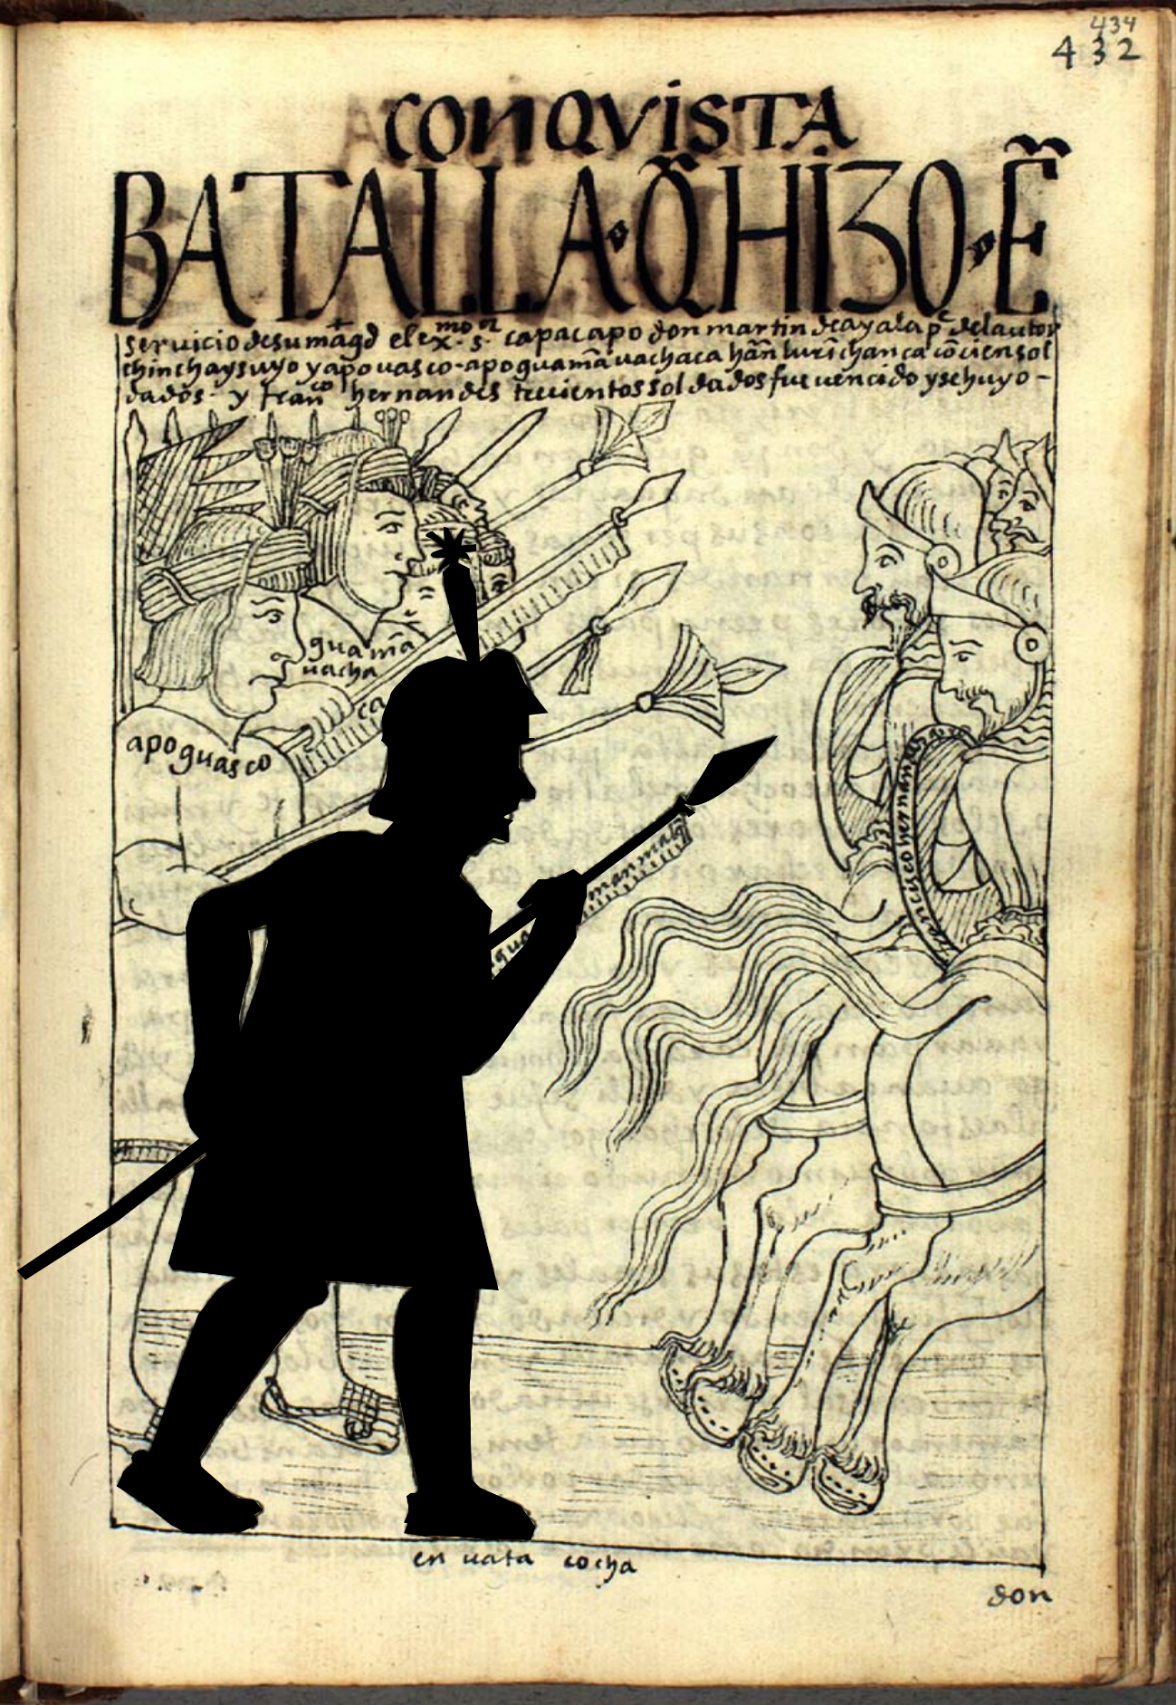
An exclusive focus on victimization, however, portrays the historically marginalized as passive and hapless in the face of the unstoppable advance of history. How can we move beyond one-dimensional depictions of victims to recover fully realized stories of historical actors who helped shape the early modern world? The first step toward such historical recovery is to highlight human presence long rendered invisible by colonial narratives. For the Spanish invasion of the Andes, various Indigenous and African participants appear only fleetingly in the historical record. Re-discovering the identities of most is impossible. Fortunately, tracing the outlines of these historical figures —literally— hints at their deeper human stories even though the details of each may remain irrecoverable. And Guaman Poma’s visually-enhanced critique of colonialism offers a symbolic dictionary of human diversity in the early colonial Andean world (fig. 8).
Image 8. The author traced, with the help of his daughter Raeka, silhouettes of 16th-century Andeans and Spaniards from the images of Guaman Poma's Nueva Corónica (1615)
Source: Guaman Poma de Ayala, F. (1615), fol. 432.
Tracing the shadowy imprint of history’s (mostly) forgotten individuals is possible through the form of silhouettes (Image 8). In the eighteenth and nineteenth centuries, the creation of silhouettes became a popular medium in which to inscribe and preserve a person’s features quickly and cheaply. Requiring less skill, time, and money to produce than the portraits so commonly commissioned by their wealthy counterparts, silhouettes allowed lower and middle-class people to memorialize the figure and likeness of loved ones. They also could be more readily reproduced with the printing presses of the time (Naeem, 2018).
In more recent years, scholars, journalists, and data visualizers have employed such human silhouettes or “anthropographics” to humanize quantitative data at the macro level, and to reconstruct the outlines of human lives only memorialized on the margins of the historical record, in the fading memories of their loved ones, and on the timeworn pages of fragmentary documentary references.
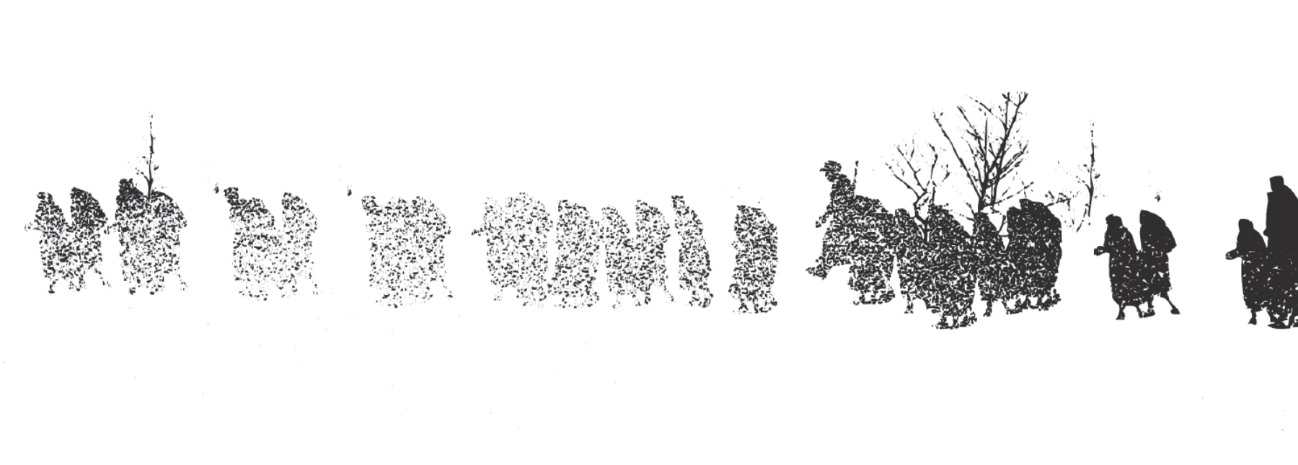
Image 9. Erik Steiner’s “silhouette visualization” of a marching column of concentration camp evacuees and guards during the Holocaust
Source: Gigliotti et al. (2014), p. 192. We are grateful to Indiana University Press for granting us permission to reprint this image.
For others, the human outline offers a way not to quantify human loss, but to reconstruct human experience. In the final chapter of Geographies of the Holocaust (2014), for example, a team of Holocaust scholars, geographers and data visualizers found that the two-dimensional maps and graphs that illustrated much of the book failed to adequately scale down to the level of individual human experience. They needed to develop new methods to examine “the geography of traumatic experience.” Thus, they experimented with “figurative symbologies” or “silhouette visualizations.” One example, shown in fig. 9, represents the human experience of these death marches, as recalled by surviving evacuees. This image unintentionally “provoked strong emotional responses” among readers (Gigliotti et al., 2014, p. 192). It also stimulates the viewer’s imagination. The white specks that increasingly veil these figures as your gaze moves from right to left, for example, may be interpreted in multiple ways. Do these specks represent the snow and harsh conditions evacuees may have had to march through while malnourished and under-clothed? Do they reflect the limited visibility —and knowledge— of what lay ahead, a horizon of the unknown that characterized the human spatial experience of such forced marches? Or do they instead evoke the fading memory of survivors, recalling their experiences of a traumatic event half a century or more later?
Scholars of early colonial encounters in the Americas also face the challenge of representing humanity and memory. How do we move past assertions of Indigenous agency to reconstruct the human experience of the people that resisted, assisted, negotiated with, leveraged, and endured European invasions of their homelands? How do we reconstruct their broader contributions, when so few traces of their stories remain?
Early in my research on the contact period, Pizarro’s legendary march from Cajamarca, through the heart of Inka territory to Cusco in 1533, drew my attention. In most retellings, even those found in more revisionist histories highlighting the role of Native allies, this journey is narrated as a deed of Spanish dominance. The many Indigenous allies, enslaved people, and others who marched with them —found along a spectrum running from the willing to the enslaved— only appear fleetingly in the documentary record. Nonetheless, I was convinced they participated in greater numbers and had a more powerful impact than either sixteenth-century accounts or modern histories admit. In previous work, I assembled different types of evidence to estimate that the Indigenous and African caravan traveling with the foreign invaders likely exceeded 10,000 people (Mikecz, 2017, 2024b).[14] To move beyond merely estimating the size of this caravan, however, I created an animated graphic reconstructing the scope of humanity that participated in this previously invisible caravan, drawing on the sketches of Guaman Poma to trace these otherwise-lost-to-history human forms.[15]
Image 10. At least 300 and as many as 500 Spanish men marched through the Inka Empire from Cajamarca to Cusco between August and November 1533
Source: created by author. Note: this is a one-tenth sample with each figure representing 10 people. However, they did not make the trek alone.
The visualization opens with the silhouettes of the 300-500 Spanish invaders who marched through the Inka Empire in 1533 (Image 10).[16] Scholars have relied almost entirely on Spanish eyewitness accounts to reconstruct this invasion as these are the only accounts that narrate it from beginning to end.[17] These eyewitness authors, however, write almost exclusively about these few hundred Spaniards and the Inka armies that resisted their advance. They refer only obliquely to the Andean guides, spies, messengers, warriors, laborers, and porters that assisted them throughout the journey. They make no allusion whatsoever to their numbers.
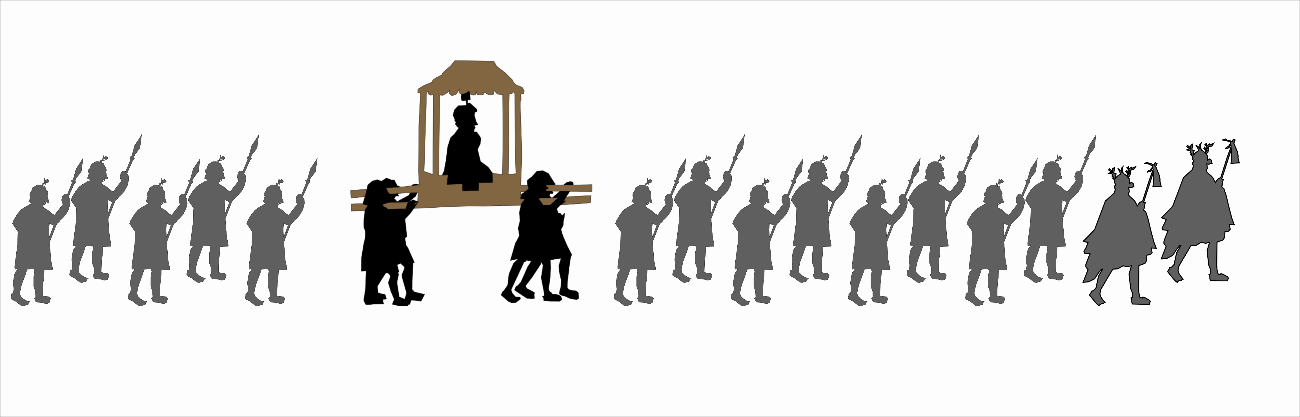
These authors only mention two Indigenous companions by name: Tupa Wallpa, an Inka heir that allied with the foreigners; and Challku Chima, the once-feared general who now was a prisoner of Pizarro and Tupa Wallpa. Yet, an Inka claimant such as Tupa Wallpa would never have traveled alone. As the newly crowned emperor —regardless of how many Andeans may have considered him legitimate— Tupa Wallpa would have commanded a large army and would have marched with a large entourage (Image 11).[18] Importantly, royal Inka women —who always played pivotal roles in political successions— also marched with the caravan (Image 12).
Image 11. Historical documents indicate that Tupa Wallpa traveled with the caravan upon a royal litter (black). Although left unsaid, he almost certainly made the journey with a large entourage (gray)
Source: created by author.
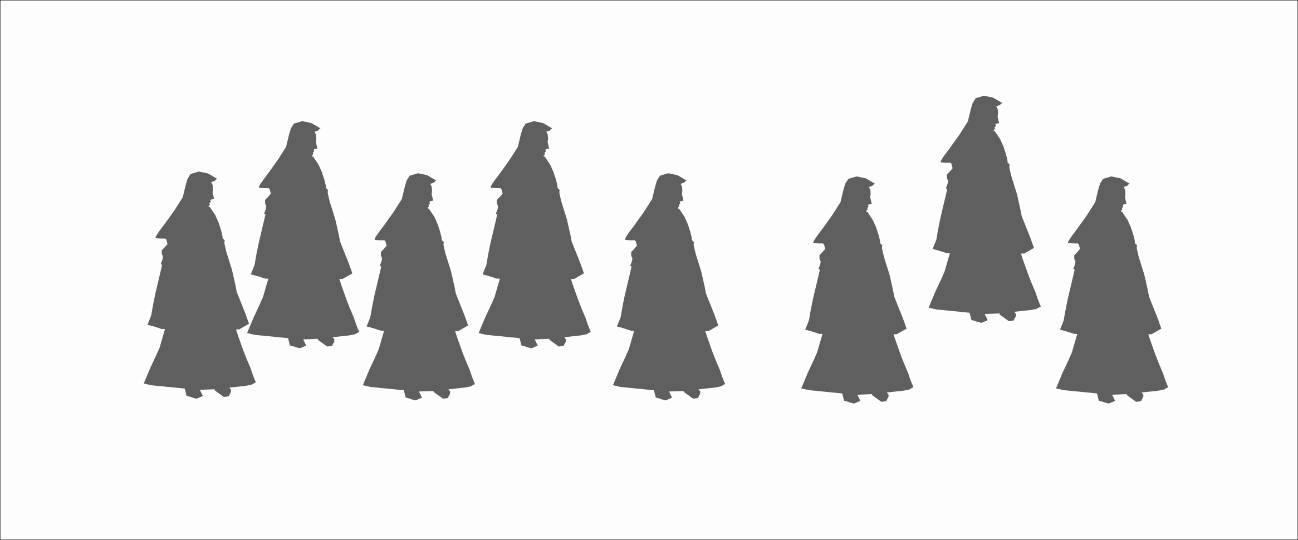
Image 12. No narrative account of the conquest (to my knowledge) acknowledges the presence of royal Inka women in the invasion of 1533. However, later petitions and trial testimony indicate their presence
Source: created by author.
Other important Inka and Andean allies traveled ahead of the Spaniards (Image 13). Two Inka nobles were scouting the enemy 700 km ahead at the very moment Pizarro and the caravan first departed from Cajamarca.[19]
We also know that various Andean provincial leaders —known as kurakas — were preparing for the Spanish advance. One powerful ally of the Spaniards, the central Andean nation of the Wankas, recalled one of their kurakas traveling ahead of the caravan and preparing the way, as well as thousands of their own people assisting the caravan’s advance and provisioning the foreign travelers with food and supply throughout (Espinoza Soriano, 1972).
Image 13. Inka messengers, spies, and other Andeans advancing ahead of the caravan
Source: created by author.
Image 14. Various Andean provincial nations marched with or assisted the caravan as it passed through their territory. These nations included the Wankas, Chachapoyas, Huaylas, Aymaraes and likely various others whose contributions were never recorded
Source: created by author.
Besides the Wankas and Inkas, many other, largely uncredited people made the long trek to Cusco with the caravan. Trudging behind the foreigners and Indigenous elites, thousands of Andean, Central American, and African allies, servants, and slaves (and everyone in between) carried food, supplies, munitions, and, yes, gold and silver (Images 14 and 15). Andean provincial militias as well as Inka armies did much of the fighting. Women of a variety of backgrounds prepared much of the food. Finally, hundreds if not thousands of llamas almost certainly trotted at the back of the caravan, carrying supplies while being guided by Andean herders.
Image 15. Thousands of porters were needed to transport food, supplies, and the large quantity of plunder the caravan brought with them to Cusco
Source: created by author.
Recovering the presence of these groups is not easy. Few Spanish authors mention their aid directly and evidence from Andean witnesses survives only in fragments.[20] Estimating the total size of the caravan is harder. Not a single author —Spanish or Indigenous— estimated the number of non-Europeans in the caravan. Only the Wankas and one other Andean provincial group quantified their own contributions.[21] Fortunately, however, other clues remain. For example, while Spanish authors wrote little about their non-Spanish companions, they do record in detail the total amount of gold and silver they brought with them from Cajamarca: at least 17,000 kg of gold and silver. Hauling such massive loot alone would have required at least 1000 human porters. This does not include the transport of food, water, and supplies, nor the numbers of Indigenous warriors and the labor needed to prepare for food and set up camp. Compiling this with other evidence suggests the Andean, Central American, and African caravan that accompanied the 300–500 Spaniards likely exceeded 10,000 people.[22]
Image 16. The animated visualization, available on my website, then scans over the entire caravan (a one-tenth sample) to capture the size of this multi-ethnic coalition
Source: created by author.
For every female Inka royal or male provincial kuraka whose presence we can construct, the identities and stories of hundreds of their common compatriots remain lost to history. The silhouettes of the “Invisible Caravan” graphic trace the faint human outlines of their contributions and their lives and, thus, hint at these lost human stories. Scrolling over the caravan as a whole (Image 16) also visually documents the magnitude and ubiquity of their contributions in a way a simple quantitative bar graph or map cannot.[23]
4. Mapping Movement: An Escorted Invasion
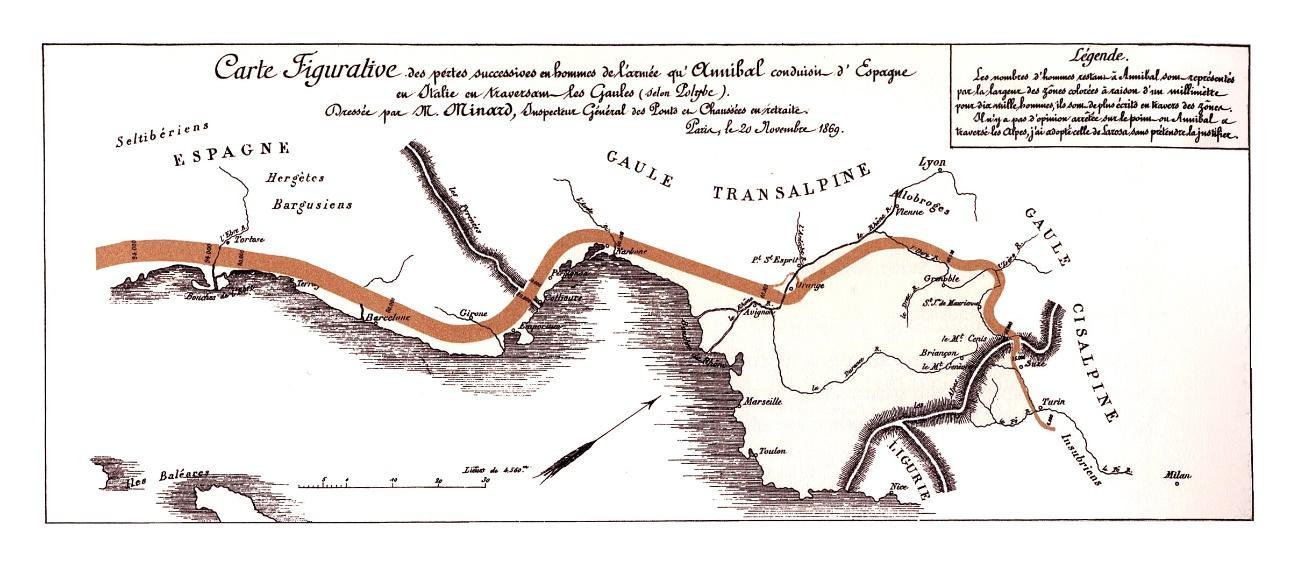
Image 17. Charles Minard’s map of Hannibal’s invasion of the Italian peninsula, 218 BCE
Source: Minard, C. J. (1869). Carte figurative des pertes successives en hommes de l’armée française dans la Campagne de Russie 1812-13 (comparées à celle d’Hannibal durant la 2èmee Guerre Punique) / Minard. Régnier & Dourdet. Gallica. https://gallica.bnf.fr/ark:/12148/btv1b52504201x
Nearly two centuries after Ogilby’s Britannia, but only a few years after Paz Soldán’s atlas, the French civil engineer Charles Minard mapped two of history’s most legendary invasions in 1869. In the first (Image 17), an orange line traces Hannibal’s audacious but ill-fated campaign through the Pyrenees, across southern France, over the Alps, and into the Italian peninsula (218 BCE; Minard, 1869). According to the legend at the top right, each millimeter of width represents 10,000 men. Small, black handwritten letters further quantify the invaders’ numbers. As we follow this line from west to east, we can see that Hannibal crossed the Ebro River (in present-day Spain) with 94,000 people, incurred heavy losses in the Pyrenees (loss of 20,000) and the Alps (another 30,000 fatalities), before passing Turin and entering the Italian peninsula with only 6,000 survivors. Like many historical maps, it conceals the imprecision and uncertainty of the historical record. In the legend, Minard acknowledges this, writing: “There is no final opinion on the point where Hannibal crossed the Alps; I have adopted that of Larosa without pretending to justify it.”[24] Also missing from this map: a graphic illustration of the fates of the thirty-seven elephants and thousands of mules, oxen, and horses that Hannibal brought with him from Carthage (Prevas, 2009, pp. 62, 177).
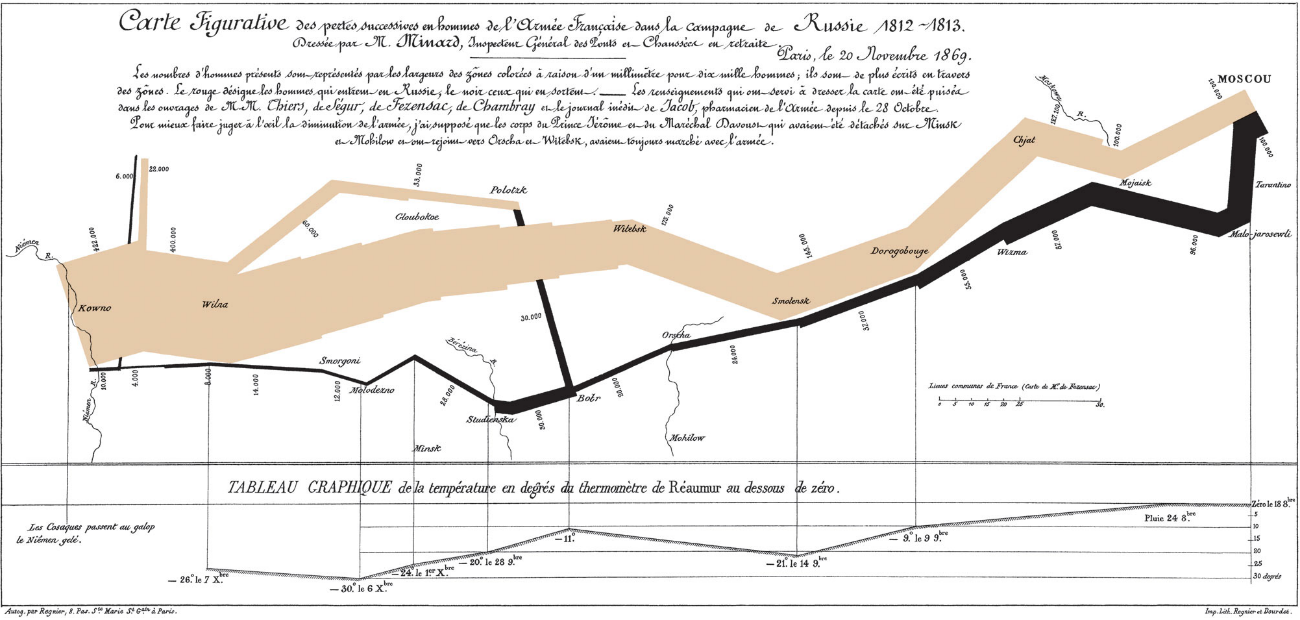
Image 18. The title, translated into English, reads: Map representing the losses over time of French army troops during the Russian campaign, 1812–1813
Source: Constructed by Charles Joseph Minard, Inspector General of Public Works, retired. Paris, 20 November 1869. Image in public domain.
The value of this map has been overshadowed by a second map printed immediately below it on the same page. This more famous image charts Napoleon’s equally disastrous invasion of Russia in 1812 (Image 18). It depicts the massive loss of human life experienced by Napoleon’s forces, as they dwindled from the 422,000 that entered Russia in June 1812 to the mere 10,000 that staggered back into Poland in December (no elephants, here, however). Edward Tufte (2007), whose books are often mandatory reading for data visualization students, argues that this graphic “may well be the best statistical graphic ever drawn” (p. 40).
Both maps inspired my efforts to re-map a third legendary invasion: the Spanish expedition that marched through the Andean highlands of the Inka Empire in 1533. As visually narrated in the previous section, Francisco Pizarro and several hundred Spaniards marched with a caravan of many thousand people that included royal Inkas (including many women), Inka armies, provincial militias and delegations, various servants, and long lines of porters—both free and enslaved. Like Hannibal before him, Francisco Pizarro (alongside Tupa Wallpa and his other Andean allies) commanded an expedition across some of the most vertical terrain in the world (Image 19).
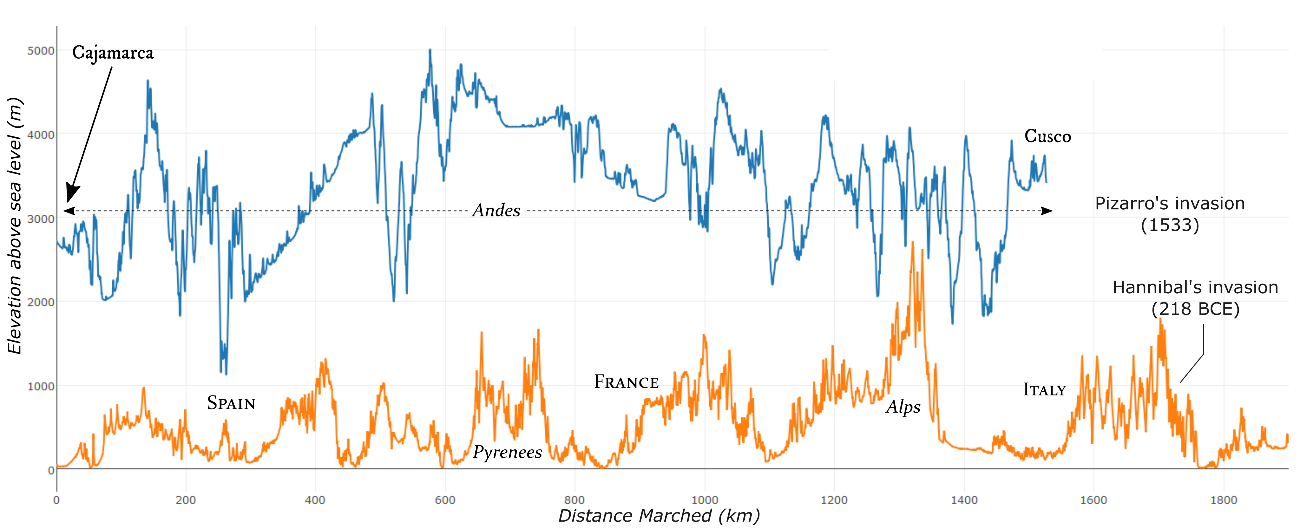
Image 19. A comparison of Hannibal’s 218-217 BCE invasion of the Italian peninsula (orange) and Francisco Pizarro’s invasion of the Inka Empire (blue)
Source: created by author.
In contrast to Hannibal and Napoleon, however, Pizarro lost few of his men. In fact, while 93.6 percent of Hannibal’s troops perished, Pizarro only lost five or six of his 300 to 500 men. Mapping Pizarro’s journey in the style of Minard reveals this distinction. The black line proceeding through the Andes only significantly thins at one point, Jauja, where Pizarro left at least 80 of his men behind (Image 20). He incurred his only fatalities —half a dozen men— in one event: the Battle of Vilcaconga. The high survival rate of Pizarro’s campaign defies expectations of what one historian has called “one of the most staggering invasions in history” (Hemming, 1970, p. 90).
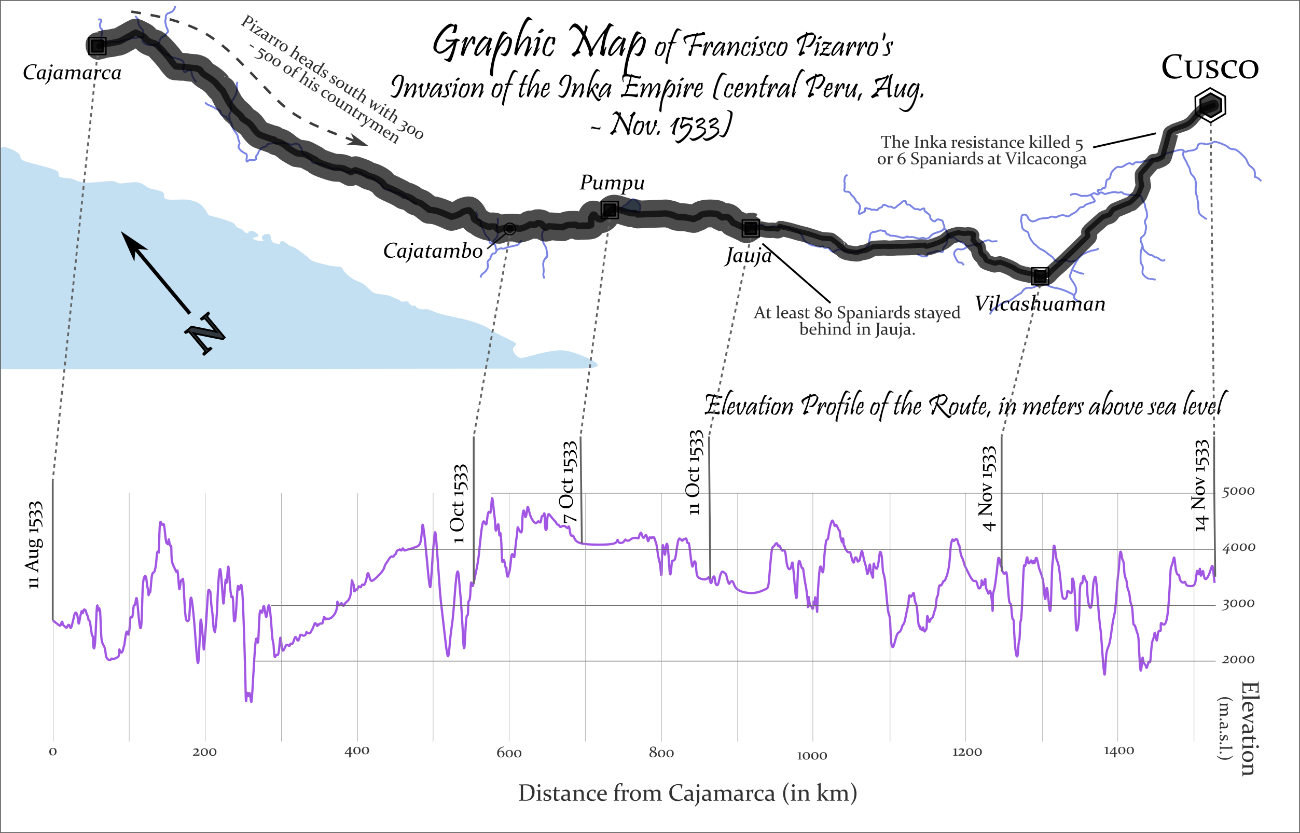
Image 20. The Spanish invasion of the Inka Empire in 1533
Source: created by author. Note: Francisco Pizarro lost only five or six Spanish men on this journey, all of whom were lost in the Battle of Vilcaconga just a few days' march before Cusco. The black line above narrows at Jauja because Pizarro had left a garrison of his men there.
The Spaniards’ march through otherwise harsh landscapes was mitigated by the thousands of Andeans, Central Americans, and people of African descent traveling with them, lugging their supplies, preparing their food, providing information, and even doing much of the fighting. Whereas the silhouettes of the previous section resurrect the contributions of the thousands who marched with the caravan, fig. 21 locates the additional assistance they received along the way.
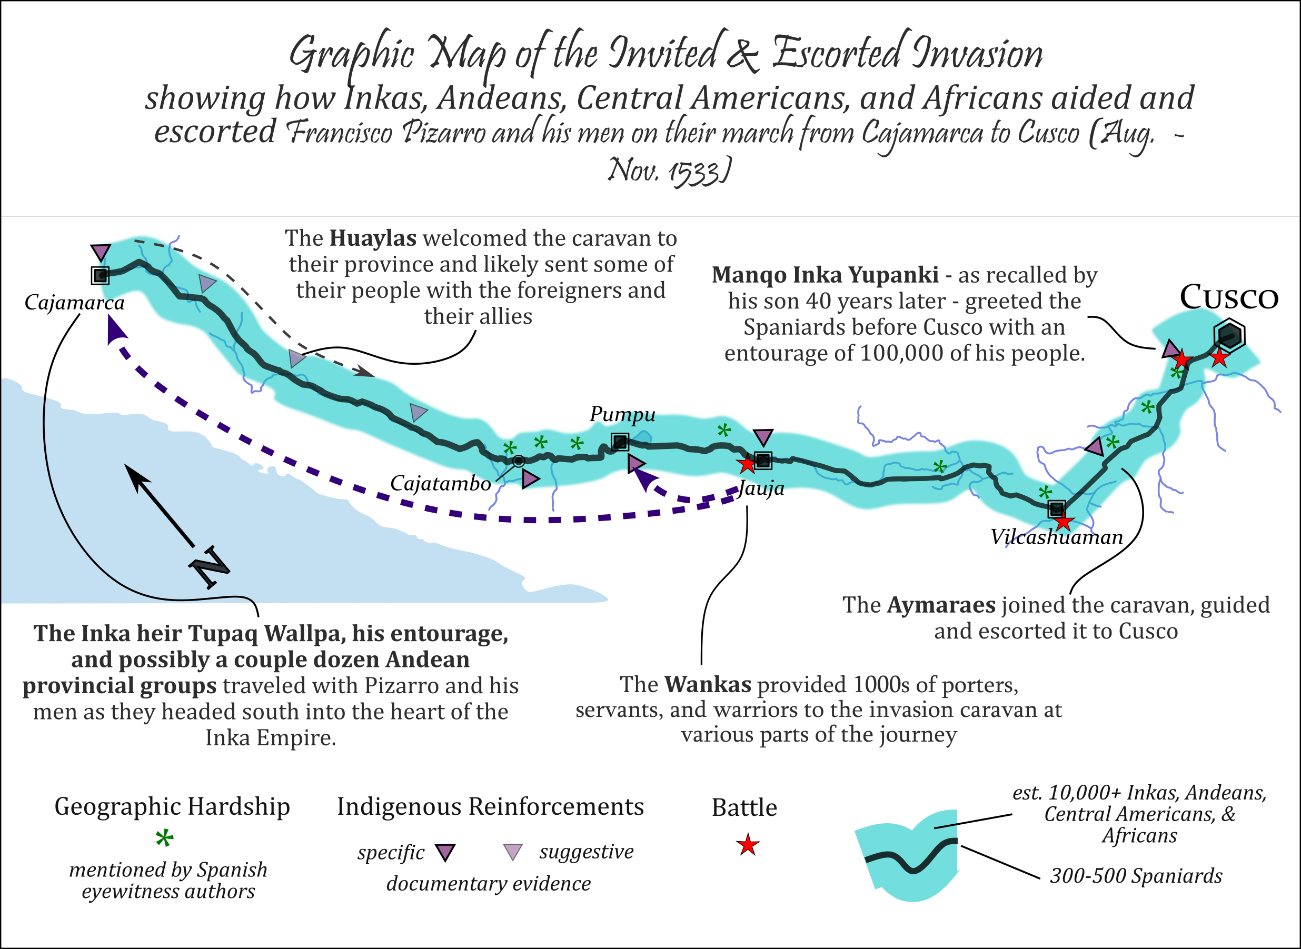
Image 21. A narrative map capturing the locations of Indigenous assistance to the invasion caravan’s advance, Aug – Nov. 1533
Source: created by author.
These maps present a different image of invasion than that charted by Minard a century and a half ago. Whereas the Frenchman graphed the loss of life of armies passing through hostile landscapes beyond the reach of their supply lines; this map recovers the aid and assistance that made Pizarro’s passage through the Andes less a military invasion and more an escorted and guided journey.
5. Charting Narratives and Human Engagement
Thus far, we have charted the itinerary of the 1533 Spanish invasion of the Inka Empire, visually reconstructed some of the long-concealed participants in this expedition, and traced an Inka army’s relentless pursuit of a small Spanish battalion a few years later, in 1536, when the invaders encountered far less favorable circumstances. Exactly how the lives and stories of some of these participants became increasingly entangled in the 1530s requires further exploration. For example, there is a common misconception that early modern “conquests” in places like Mexico and Peru were waged between homogenous groups —Spanish conquistadors v. Indigenous armies, for example— and that all conflicts were resolved on the battlefield. Instead, the Spanish benefited from Indigenous and African help since the beginning. By 1536 and 37, battles were commonly waged between competing inter-ethnic factions of Inkas, Andeans, Spaniards, Central Americans, and Africans. Distinguishing between friend and foe was often quite difficult. To fully understand the factionalism and complex alliances that increasingly characterized invasion-era Peru requires a more careful look at other actors and events: the royal Inka women who maneuvered behind the scenes to prop up an Inka heir or Spanish imposter, the hundreds of provincial Andean leaders that composed the many multi-ethnic coalitions that emerge during the 1530s, the Spanish rebels who fought with Inka and Andean militias against their compatriots, and the many spies, messengers, diplomats, porters, and laborers who lurked on the periphery of the action (Lorandi, 2005; Vicuña Guengerich, 2015; Dumett, 2018; Mikecz, 2024a).
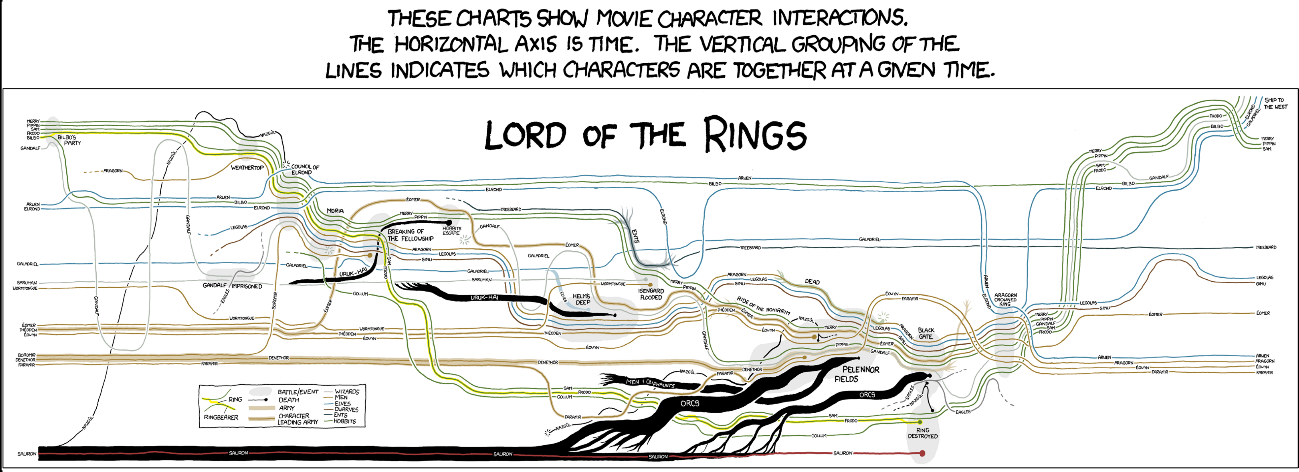
How can we chart this multitude of storylines and character arcs across time and space as they became increasingly entangled? Although time-series graphs date back at least a few hundred years, the plotting of narratives and the characters contained within appears to be a more recent phenomenon. For example, a series of narrative charts created by Randall Munroe, an American cartoonist and former NASA engineer and physicist, plot the trajectory of characters across some popular films. The chart below, for example, traces the activity of over two dozen Lord of the Rings characters of various species as their paths intersect and diverge again throughout the film trilogy. It follows how fellowships brought humans, dwarves, and hobbits together and war pulled them apart (Image 22).
Image 22. Randall Munroe’s narrative chart of the Lord of the Rings film trilogy
Source: Munroe, R. (n.d.). Movie narrative charts [Webcómic]. xkcd. https://xkcd.com/657/large/
Curiously, the grand narratives of the Spanish invasion of the Inka Empire share a lot in common with fantasy epics. Like Lord of the Rings, Spanish and Andean accounts of the conquest era are full of stories of apocalyptic battles and epic marches through difficult terrain. Also, like some of these fantasy novels, traditional accounts frequently render women invisible. New research, fortunately, resurrects their importance as intermediaries and political powerbrokers. Power in the early colonial Andes was often brokered by these female intermediaries as well as other diplomats and intermediaries. More akin to Game of Thrones than Lord of the Rings, it was ratified through public alliances and secret pacts alike and involved mixed and fluid factions that operated in a moral gray zone: neither entirely good nor evil. Battles were still frequent, but often quickly devolved into conflicts where Inkas, Andeans, Africans, and Europeans fought and maneuvered on both sides (Mikecz, 2024a, especially Ch. 11).
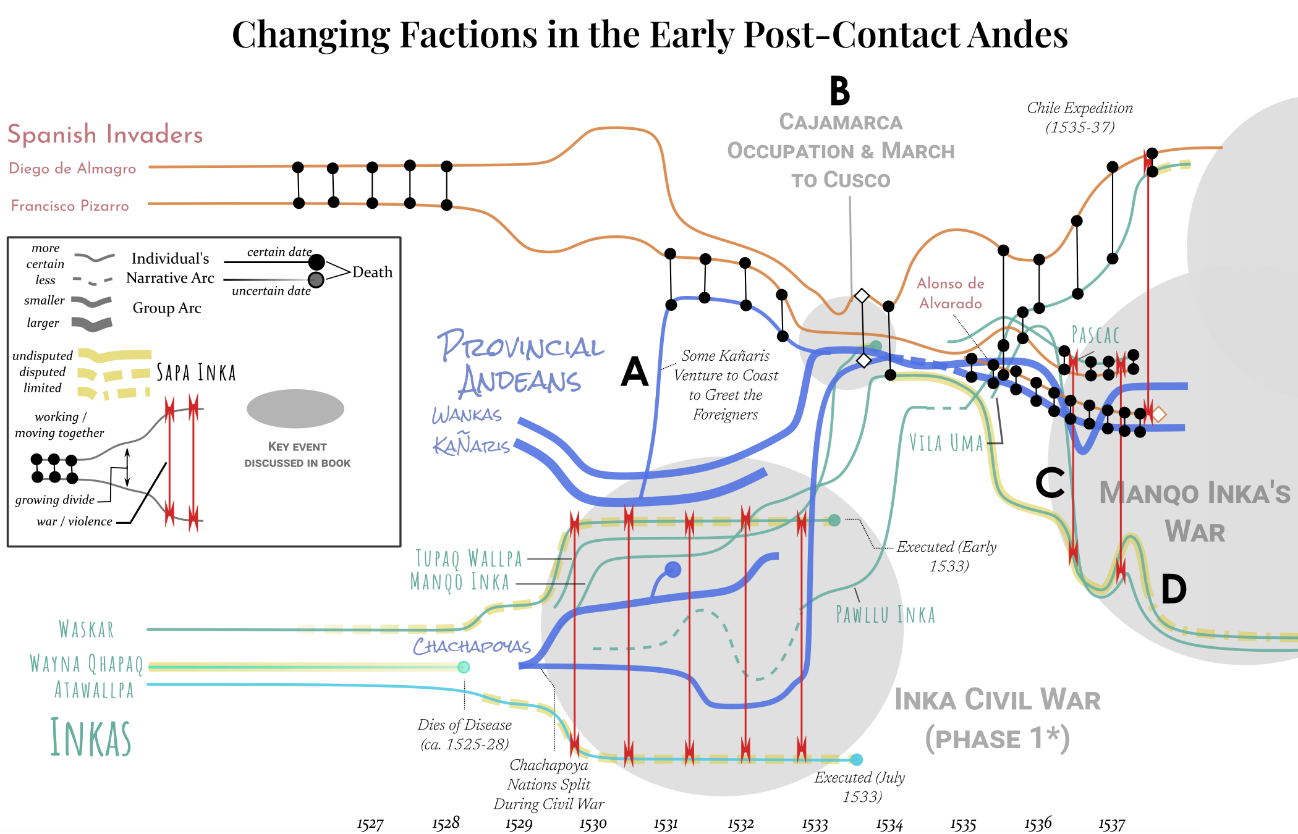
Image 23. A Narrative Chart tracing the trajectories of various Spanish (orange), Inka (blue-green) and provincial Andean actors as their paths became increasingly entangled in the late 1530s
Source: created by author.
A narrative chart of the initial conquest period (1532-1537) visually conveys the ever-changing nature of these political entanglements and military alliances (Image 23). Whereas Munroe traces character interactions in Lord of the Rings, this graphic also charts the nature of these interactions (with black “barbells” symbolizing collaboration and the red lines representing warfare). The Inkas were already divided when the Spaniards first entered the Inka Empire in 1532. When the foreigners arrived at the northern coastal imperial outpost of Tumbes in 1532 —a town they had visited four years prior during their explorations down the coast— they found it in ruins. The people of Tumbes had been warring with their adversaries across the bay on the Island of Puná, a war that was likely an extension of the larger Inka civil war roiling the Inka highlands. After the emperor Wayna Qhapaq died (ca. 1524-1528), two of his sons (Atawallpa and Waskar) waged an empire-wide civil war over the right to succeed their father (ca. 1528/1530-1533).
Provincial Andean nations were forced to take sides. One northern group, the Kañaris, sided with Waskar. When Atawallpa’s armies drove Waskar’s back toward Cusco, Atawallpa brutally punished the Kañaris for aligning with his brother. The arrival of the strange foreigners along the coast provided them the surprising opportunity to reverse their fortunes. A delegation of Kañaris thus journeyed to the coast to greet the Spaniards (A in Image 23).
On first glance, the civil war came to a sudden halt in 1532 and 33 with Atawallpa’s defeat and execution of Waskar, and Atawallpa’s own execution at the hands of the foreigners. It is here that the various orange, blue, and blue-green lines on the graphic above converge (B). Many Andean nations —and some Inka factions— met with the foreigners in Cajamarca and negotiated various alliances with them, the Inka heir Tupa Wallpa, and each other in early 1533 (Mikecz, 2024a, Ch. 5). Half a year later, Manqo Inka escorted the Spaniards into the imperial capital of Cusco. The Inka Civil War certainly seemed resolved by 1534, when Manqo Inka aligned himself with the Spaniards and drove the remnants of Atawallpa’s armies back to the Quito region. Yet, the peace would not last. The contest for control of the empire would enter a new phase in 1536 when Manqo turned on his former allies and attacked the Spanish occupants of Cusco, Lima, and everywhere in between (C). His brother, Pawllu, and one of his generals, Pascac, wielded their respective political and military power to protect the Spanish colony, ultimately forcing Manqo’s retreat into the rainforest (D; Murúa, 1987, Ch. 66).[25]
These stories, as embodied in the chart above, illustrate the complicated nature of Andean politics and warfare in the late 1530s. While Spanish authors commonly bragged that the conquest had been secured with Manqo’s defeat, the reality on the ground was far less clear. Manqo still commanded the allegiance of an army of over twenty thousand troops, which wreaked havoc on the Andean countryside.[26] This army frequently emerged from the rainforest to rob and loot the settlements of their Spanish adversaries and the Andean communities that aligned with them. Meanwhile, Manqo’s brother Pawllu continued exercising power from within the Spaniards’ orbit.
6. Conclusion
As with the intricate graphics of cartographers and mapmakers like Ogilby and Paz Soldán, a lot can be missed in a quick reading of historical accounts of the Spanish invasion. Narratives, like maps, are created by people with agendas and are constructed amid political contexts often not immediately evident to later readers. However, as Charles Minard, Florence Nightingale, and W. E. B. DuBois showed during the nineteenth-century golden age of infographics, visualizations can also interrogate historical narratives in direct and impactful ways.[27] Their innovative hand-drawn graphic —sometimes printed with lithographic presses— inspire today’s data visualizers working in a digital age. In contrast to conventional digital data visualization and its emphasis on creating easily digestible plots of quantitative data, nineteenth century infographics encouraged visualizers to tell stories, make arguments, and dazzle the viewer’s eye while educating their mind.
Some twenty-first-century data scholars and designers have expanded the scope of data visualization. I shared three such modern examples: R. J. Andrews’ map of infographic firsts, Randall Munroe’s whimsical movie narrative charts, and the Geography of the Holocaust’s innovative visual storytelling and argumentation. Others have returned visualization to its roots: showcasing how printed maps and hand-drawn graphics can tell stories and reveal patterns (Lupi & Posavec, 2016). Inspired by these recent and not-so-recent examples, various narrative maps, qualitative visualizations, and silhouettes of forgotten figures line the pages of my forthcoming book At the Edge of the Map: The Andean World during the Spanish Invasion. None are as expertly drawn as those of Minard or as intricately rendered as the geo-visualizations of Paz Soldán and Humboldt (although, in my defense, many of those nineteenth-century visualizers had teams of assistants). Yet, I hope they reveal patterns and tell stories not immediately evident or even visible through a traditional reading of historical texts.
For example, the scroll map of Image 6 visually reveals the many ways that the Inkas creatively used Andean topography and information networks to their advantage in their relentless pursuit of a Spanish relief expedition. It also maps events that we cannot locate on a Cartesian coordinate map with certainty. In this it departs from Ogilby’s 1675 original. Ogilby created a literal road map for an invasion that never happened, with enough spatial precision to guide foreign invaders straight to the capital. Meanwhile, I sought to trace a campaign that did happen, but left behind limited evidence in the historical record. The few surviving eyewitnesses to record their experiences convey a vague understanding of the Andean landscapes they passed through during their desperate flight from the mountains down to the coast.
The desperate retreat of Spanish expeditioners in 1536 directly contrasts with their descriptions of seemingly easy travel through the Andes in 1533. To better understand this difference, I sought to mimic Charles Minard’s 1869 maps of two other legendary invasions. There was just one central problem. In contrast to the Hannibal and Napoleon invasions, we lack quantitative records for the number of troops and auxiliaries that assisted the Spanish advance. However, this was not by chance. Rather, Spanish authors deliberately sought to conceal the many Andean warriors, porters, and other laborers that marched with them as well as the “good reception” they received in the central Andean provinces they passed through.[28]
Recovering the humanity of the many long-forgotten participants in this invasion posed another challenge. For this, I had to move beyond points, lines, and polygons and seek inspiration in human form. Sixteenth-century anti-colonial drawings by Guaman Poma, nineteenth-century silhouette portraits, and twentieth-century photography and filmmaking inspired my efforts to re-animate a previously invisible caravan. Sketching the silhouettes of the many different types of participants in this expedition evokes the ubiquity and importance of Indigenous contributions and the magnitude of their losses. It also hints at the diversity and complexity of Indigenous America.
Indeed, early colonial encounters were never as one-sided, nor as black-and-white, as later interpretations often suggest. In the Americas of the sixteenth century, for example, Indigenous Americans did much of the fighting, performed much of the labor, and provided much of the information that made European invasion and settlement possible. We should not, however, replace one overly simplistic story with another: Native South Americans were neither passive victims nor unwitting accomplices. Rather, they reacted to a complex situation in diverse and complex ways. Under difficult and rapidly changing circumstances, they pursued their own ends and sought the best outcomes for themselves and their people. Charting narratives of these early encounters in the Andes reveals just how quickly they became entangled in and, yes, took advantage of multi-ethnic coalitions. Visualization, thus, is neither bound by the narrow expectations of modern data science nor by the imperial demands of early modern maps. It can, instead, tell alternative narratives, chart counter-maps, and recover forgotten historical actors. The resulting counter-maps, counter-visualizations, and counter-narratives can debunk colonial myths and interrogate persistent but misleading historical myths.
Bibliographic references
Notas
[1] Paz Soldán, M. F. (1865). Cuadro general de las alturas comparativas del Perú. Atlas geográfico del Perú, Plate LXIII. My thanks to Lucinda Hall and Peter Allen in the Evans Map Room at the Dartmouth Library (Hanover, New Hampshire) for allowing me to view a copy of this atlas.
[2] The historic centers of Cusco and Paris lie at approximately 71.98 degrees west and 2.35 degrees east of the Prime Meridian, respectively. In this image, Paz Soldán places Cusco (#71) at roughly 74.4 degrees west of Paris. The Greenwich Prime Meridian was not formally adopted by an international body until 1884 and the French continued to use the Paris meridian until 1911.
[3] The data journalist and data visualization expert Alberto Cairo (2016) defines a data visualization as “a display of data designed to enable analysis, exploration, and discovery” (p. 31).
[4] Christine Haynes (2010) describes how the emergence of a literary marketplace in the late eighteenth to late nineteenth century was supported by “the growth of the reading public, a rise in consumption, the development of new sources and forms of credit, the mechanization of papermaking and printing, the invention of stereotypography and lithography, the spread of the railroad, and the institution of mass education” (p. 4).
[5] Humboldt, A. von & Bonpland, A. (1805). Geographie des Plantes Equinoxiales: Tableau Physique des Andes et Pays voisins. David Rumsey Map Collection. https://www.davidrumsey.com
[6] A prominent influence was the geographer Francisco José de Caldas, whose “drafting and cartographic skills” according to Ernesto Capello, “far exceeded Humboldt’s” (2020, pp. 56-57).
[7] Notable exceptions include: Moretti (1998); Knowles et al. (2014); Eltis & Richardson (2015).
[8] Some rare recent exceptions include Klein (2013) and Brown (2015).
[9] Alberto Cairo (2020), among others, has argued for the need to teach visualization literacy or what the geographer William Balchin calls “graphicacy” (p. 18). Meanwhile, others have argued for a closer attention to the human context and stories behind data, including how best to represent this in visualizations (Lupi, G. (2017, January 30). Data Humanism: The Revolutionary Future of Data Visualization. PRINT Magazine. https://www.printmag.com/article/data-humanism-future-of-data-visualization/; D’Ignazio & Klein, 2020).
[10] As Margaret Wickens Pearce and Michael Hermann (2010) argue, “We ask so little of maps today. Unlike books, articles, and paintings, maps as an expressive form are expected always to summarize and simplify events for easy consumption by the reader”. In contrast, they created a “complex, challenging” map that “cannot be digested in one sitting” (p. 46).
[11] The term “Inka” was a special term reserved for the imperial ruling elite. Thus, “Andean” is used here to describe Indigenous people of the region, whether they were subjects of the empire or not.
[12] In his recent narrative history, Alan Covey (2020) has highlighted how the Inka heir Tupa Wallpa essentially escorted the Spaniards on the first half of their march to Cusco, before his death at Jauja.
[13] In contrast to much of the scholarship in English, South American scholars have long shown how our view of “The Conquest” changes when we center Manqo Inka’s War (Cúneo-Vidal, 1926; Guillén Guillén, 1994).
[14] I outline this evidence in my dissertation and in a forthcoming article (Mikecz, 2017, 2024b).
[15] Mikecz, J. (2022). The Invisible Caravan: The Forgotten Participants of the Spanish Invasion of Inka Peru (1533) [Personal website]. Jeremy Mikecz. http://jeremymikecz.com/caravan/invasion_caravan.html
[16] They often called themselves “conquistadores.” However, their claim to be conquerors was often more aspirational than earned.
[17] The most detailed Spanish accounts were written by Pedro Sancho (1917/1534) and Pedro Pizarro (2013/1571).
[18] Several Spanish eyewitnesses describe Tupa Wallpa departing with the expedition, but they mention him so infrequently that a reader would be forgiven for forgetting about his existence. Moreover, they make only passing allusions to the people that served him, such as when Pedro Sancho (1917/1534 Ch. 3) describes “certain envoys” of Tupa Wallpa returning with information about the location of the Quito Inka army. One exception is a letter written by a group of Spaniards one year later, in which they recalled Pizarro “bringing with him this new cacique,” by which they meant Tupa Wallpa, as well as “many other lords and principals” (Ayuntamiento de Xauxa,1884, p. 117).
[19] These nobles were Wari Tito and Mayta Yupanki. Pedro Pizarro, one of only two sources to mention Wari Tito by name, recalls Wari and Mayta offering to “protect” and prepare the way for the Spaniards (Pizarro, 2013/1571, Ch. 9, p. 57).
[20] The most detailed and comprehensive provincial Andean account comes from the Wankas between 1558 and 1561, who recalled providing the Spaniards with several thousand porters and fighters during the 1533 march to Cusco. These documents quantify their contributions but say little about their actual experiences of the journey (Espinoza Soriano, 1972). Other insightful, if more fragmentary, accounts about Indigenous participation in this invasion come from the Chachapoyas, Aymaraes, the Inka heir Titu Kusi Yupanki, and a critical reading of Spanish narratives and trial testimony (Mikecz, 2024a).
[21] This other group was the Aymaraes, who testified in 1663 that 800 of their ancestors escorted the foreigners on their final approach to Cusco. For more on the Aymaraes, see Mikecz (2024a, Prologue to Part 1 and Ch. 7).
[22] For more on how I calculated these numbers, see Mikecz (2017, 2024b).
[23] To view the full animated visualization, see: http://jeremymikecz.com/caravan/invasion_caravan.html. For the conference presentation this animation originated with see: http://jeremymikecz.com/CLAH2022.html
[24] Dawn Finley and Virginia Tufte (n.d.) believe this “Larosa” was likely Jean-L0uis Larauza, a French author of a 1826 history of Hannibal’s invasion.
[25] Inka, P. (1540). Informaciones: Pablo Tupac Inca (Lima, 204, n. 11). Archivo General de Indias, Sevilla, España.
[26] Colección Betancur, [Archival collection], volumen 5. Answers to Question 5 posed on fols. 648-669 and 875-883v. Archivo Regional del Cusco, Cusco, Perú.
[27] The use of data visualizations to make arguments, however, necessitates the teaching of visual data literacy or “graphicacy” (see footnote 7).
[28] In a 1534 letter, Spanish occupiers described the local aid they sought to hard to conceal in other documents when they wrote of the “good reception” they received from Andeans for the first half of the journey southward (Ayuntamiento de Xauxa, 1884, p. 117).